Teacher Resources

Graph a Demand Curve Interactive Practice


Try Interactive Practice


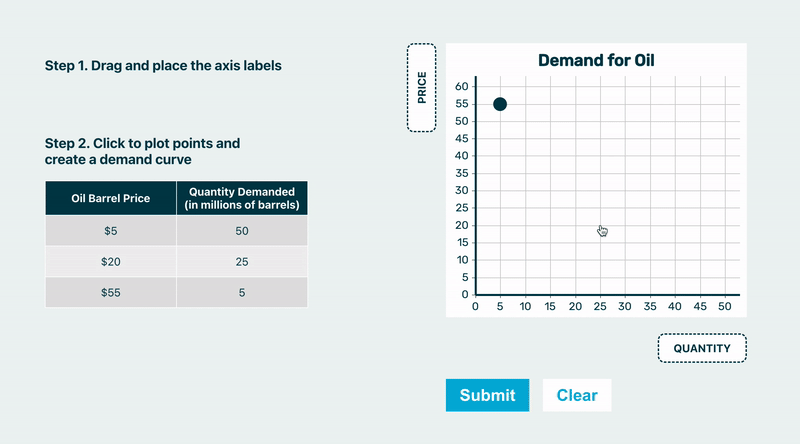
New interactive practice tool: This interactive practice tool helps students learn the basics of building a supply and demand graph. Students label the price and quantity axes, then practice using a demand schedule to draw a demand curve. Plotting several points for specific quantities demanded at specific prices helps to reinforce what the demand curve represents—and the reason why demand curves slope downward for normal goods.

Resource Details

Academic Level

High School or University

Be the first to comment

Plain text

  • No HTML tags allowed.
  • Lines and paragraphs break automatically.
  • Allowed HTML tags: <em> <strong> <cite> <blockquote> <code> <ul> <ol> <li> <dl> <dt> <dd> <br> <p>
1 + 3 =
Solve this simple math problem and enter the result. E.g. for 1+3, enter 4.

Looking for more resources?

Sign up and receive updates on new videos, test banks,
and classroom activities!