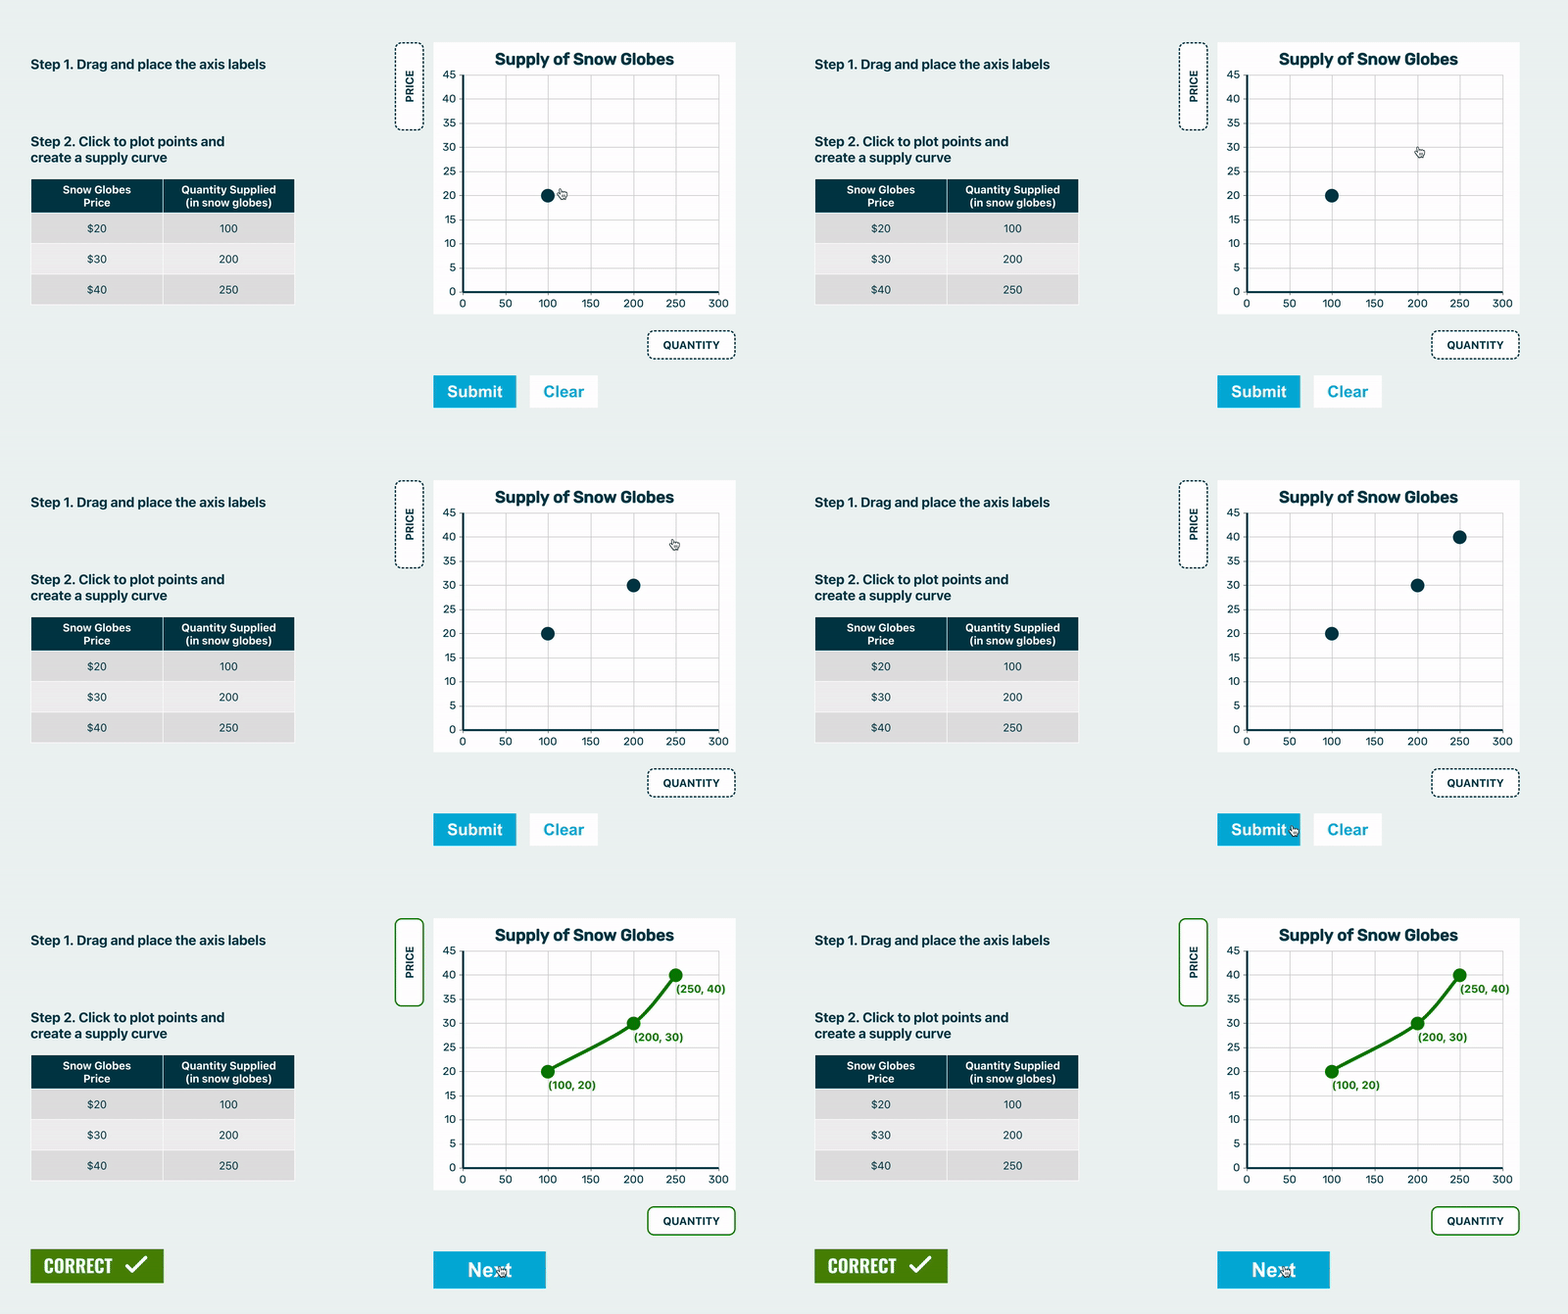
New interactive practice tool: This interactive practice tool helps students learn the basics of building a supply and demand graph. Students label the price and quantity axes, then practice using a supply schedule to draw a supply curve. Plotting several points for specific quantities supplied at specific prices helps to reinforce what the supply curve represents—and the reason why supply curves slope upward for normal goods.
- High School
- University


1 Comment
Pretty cool. Just needs some more graphs