Does the Equilibrium Model Work?
Course Outline
Does the Equilibrium Model Work?
Does the equilibrium model work? Nobel Prize winner Vernon Smith conducted experiments testing this model and found that time and time again, the model did indeed work. This video takes a look at Smith’s evidence and analyzes other instances where market conditions shift either the demand or supply curve, and the equilibrium model comes into play.
Teacher Resources
Related to this course
See all Teacher Resources related to this course
Transcript
Now that we understand supply and demand and the equilibrium process, we can ask, "Does the model work?"
Some of the most impressive evidence was developed in 1956 by Vernon Smith, one of the founders of experimental economics. Smith actually expected that his lab experiments, which I'll describe in more detail shortly, he expected that they would disprove the model. But he was shocked when time and time again, the model predicted exactly what happened. Vernon Smith was awarded the Nobel Prize in economics in 2002. Let's take a look at what he did.
Smith's first experiments were very simple. He gave a group of students, called the buyers, cards similar to these, which told them the value that they placed on a good, the maximum they would be willing to pay for the good. He then did the same thing for sellers, giving them cards, which told them their costs, the minimum price at which they would be willing to sell the good. Notice that the distribution of buyer values determines a demand curve. At a price of $3.50, for example, the quantity demanded would be 1. But as the price falls to let's say just below $3, the quantity demanded would increase to 2. Similarly, the distribution of cards for the supplier costs determines a supply curve.
Moreover, because Smith knew the values that he distributed, he could calculate the demand and the supply curves and the predicted equilibrium prices and quantity. Smith let the students make trades in a double oral auction. Traders would call out, "I'll sell for $2," "I'll buy for $1," and so forth. Any time two traders agreed to a deal, the price would be called out, "Sale at a price of $1.50." If a buyer and a seller, say this buyer and this seller, agree to make a trade at let's say a price of $1, then the seller would earn the price minus their cost. In this case, the seller would earn a profit of 25 cents, the price minus their cost. Similarly, the buyer would earn their value, $2.25 in this case, minus the price, $1, for a profit of $1.25. Now, here was another key to Smith's market. He actually paid the traders their profits in real money. So Smith's experimental market was a real market, with a real demand curve, a real supply curve, and traders who had an incentive to maximize the gains from trade.
So what happened? Here are the results from one of Smith's remarkable experiments. The demand and supply curve calculated by Smith are shown here on the left. The model predicts an equilibrium price of $2, and an equilibrium quantity of 5 or 6 units. What actually happened is shown on the right. The actual market price quickly went to $2 or very close to it. The market quantity quickly went to 5 or 6 units. Moreover, exactly as predicted by the model, the buyers with the highest values bought, and the sellers with the lowest costs sold. In short, almost all the gains from trade were exploited, leading to near maximum efficiency, exactly as predicted by the model.
Another way to test the model is to examine its predictions about what happens when the demand or supply curves shift. In fact, what makes the demand and supply curve model so powerful is that you can analyze any change in market conditions using a shift in either the demand or a shift in the supply curve. That will produce a prediction about what will happen. You should be very familiar with demand and supply curve shifts. Let's run through a few examples. The key here is to understand the logic, not to try to memorize the results of every possible shift. If you understand the logic, then with a few curves, you'll always be able to duplicate and to understand exactly what the model predicts.
Here's the market for laptops, for the demand and the supply of laptops. We all know that technology has reduced the cost of computer chips -- Moore's Law and all that. The reduction in the price of computer chips reduces the cost of producing laptops. A reduction in costs is modeled by an increase in supply. The supply curve moves to the right and down. So what does the model predict? The model predicts, therefore, that the price of laptops will fall and the quantity bought and sold will increase. Pretty good prediction.
Now, let's look at the market for portable generators. Let's suppose that a hurricane is approaching. What will the approaching hurricane do to the demand for generators? Well, it will increase the demand, shifting the demand curve up and to the right. What does the model predict? The model predicts an increased price of generators and a greater quantity exchanged. Also, pretty good prediction.
Using the simple but powerful model of supply and demand, you can also understand important events in world history. Let's look at the price of oil over the last 50 or 60 years. Here's the price of oil since 1960. We can see a few key events. In 1973, for example, OPEC first flexed its power by reducing the supply of oil in an embargo. What you can see is that the price of oil skyrocketed. The big price increase makes sense because there aren't many good substitutes for oil in the short run. We're gonna be talking more about the elasticity of demand in future videos. The Iranian revolution and the Iran-Iraq war were also important supply shocks, negative supply shocks, which pushed up the price of oil. A higher price, however, encouraged more exploration. And as additional sources of oil were discovered in the North Sea and in Mexico, the price of oil began to fall.
Another key event occurred in the 2000s as growth in China and India increased. That increased the demand for oil, pushing up the price. For the first time, millions of people were able to afford a car, and that increased the demand for oil. You can see that increased demand continued until this big drop in the price of oil in 2008, 2009. What's that? That, of course, is the demand shock from the big recession and the financial crisis, which hit the United States and Europe especially hard, reducing the demand for oil, at least until the recovery has started to occur. What you can see here is that the simple supply and demand model provides a very useful framework for understanding our world. Thanks.
Subtitles
- English
- Spanish
- Chinese
- Hindi
- French
- Arabic
Thanks to our awesome community of subtitle contributors, individual videos in this course might have additional languages. More info below on how to see which languages are available (and how to contribute more!).
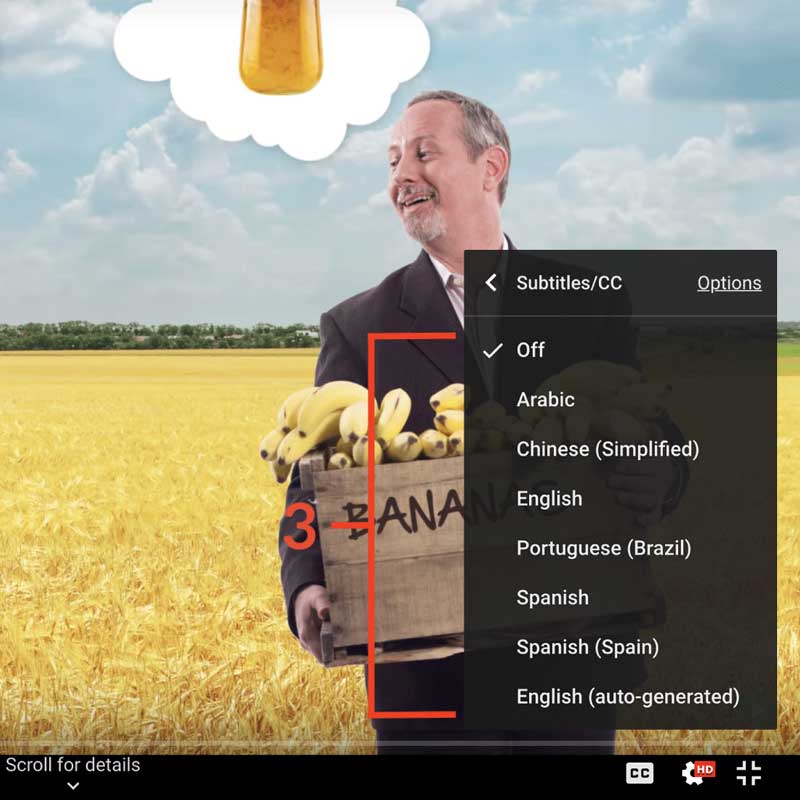
How to turn on captions and select a language:
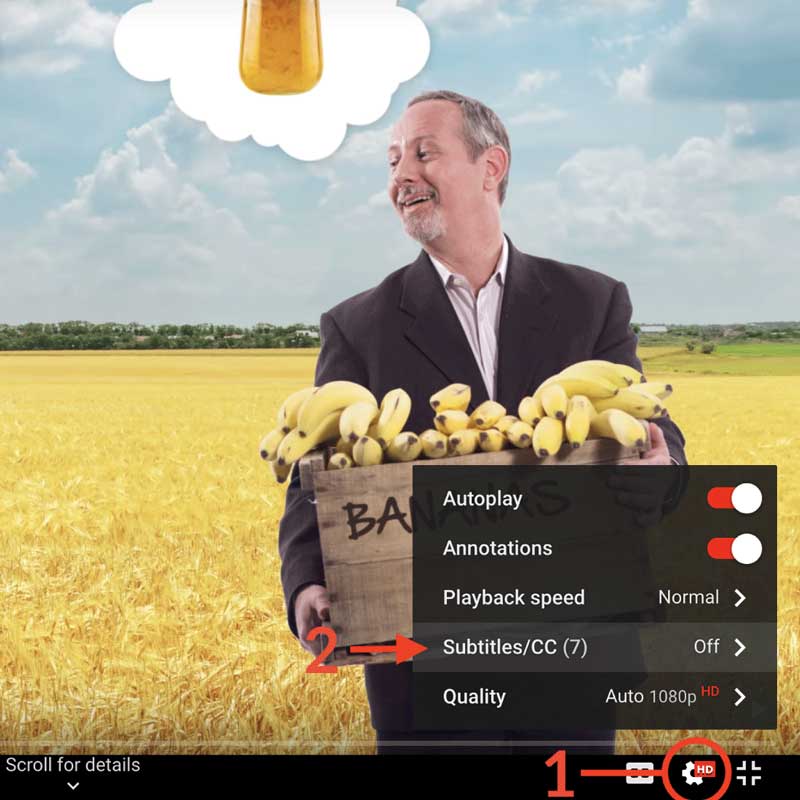
- Click the settings icon (⚙) at the bottom of the video screen.
- Click Subtitles/CC.
- Select a language.


Contribute Translations!
Join the team and help us provide world-class economics education to everyone, everywhere for free! You can also reach out to us at [email protected] for more info.
Submit subtitles
Accessibility
We aim to make our content accessible to users around the world with varying needs and circumstances.
Currently we provide:
- A website built to the W3C Web Accessibility standards
- Subtitles and transcripts for our most popular content
- Video files for download
Are we missing something? Please let us know at [email protected]
Creative Commons

This work is licensed under a Creative Commons Attribution-NoDerivatives 4.0 International License.
The third party material as seen in this video is subject to third party copyright and is used here pursuant
to the fair use doctrine as stipulated in Section 107 of the Copyright Act. We grant no rights and make no
warranties with regard to the third party material depicted in the video and your use of this video may
require additional clearances and licenses. We advise consulting with clearance counsel before relying
on the fair use doctrine.


