Understanding the Supply Curve: Shifts and Producer Surplus
Course Outline
Understanding the Supply Curve: Shifts and Producer Surplus
What does the supply curve show us? This video takes a look at what we can tell from the supply curve about the behavior of sellers and quantities supplied at different prices. We’ll talk about producer surplus as well as factors that lead to an increase in supply and a decrease in supply — and we’ll provide a list of these important supply shifters.
Teacher Resources
Related to this course
See all Teacher Resources related to this course
Transcript
Today we turn to look at the supply curve. I'm going to move through this material a little bit more quickly than through demand because many of the ideas are similar.
The supply curve represents the behavior of sellers and the supply curve is a function that shows the quantity supplied at different prices. The quantity supplied is the quantity that producers are willing and able to sell at a particular price. Okay, here comes our supply curve just as before. The horizontal reading tells us the quantity supplied at each price, in other words, how much suppliers are willing and able to sell at each price. At a price of $20 per barrel, suppliers are willing and able to sell 30 million barrels of oil per day. The vertical reading tells us the minimum price at which suppliers will sell a given quantity.
For example for the 50th millionth barrel of oil, suppliers are willing and able to sell that barrel of oil for $55. Once again the vertical reading tells us the minimum price at which suppliers will sell a given quantity. As before, sometimes the horizontal reading is a little bit easier to understand some problems, other times the vertical reading is a little bit easier. So it's important that you be comfortable reading the supply curve in both ways.
Producer surplus is just the producers' version of consumer surplus. Remember, consumer surplus is the consumers' gain from exchange, so producer surplus is the producers' gain from exchange. It's the difference between the market price and the minimum price at which producers would be willing to sell a given quantity. Total producer surplus is the sum of the producer surplus of each seller. As I'll show you in a minute, what this means graphically is that total producer surplus is measured by the area above the supply curve and below the price.
Let's take a look.
Producer surplus is the area above the supply curve and below the price. Here's our supply curve -- suppose that the price is $40 and the producer surplus at that price is this blue area right here. We could think about this as the producer surplus at the lowest cost to suppliers, plus the producer surplus at the second lowest, plus the producer surplus at the third lowest, the fourth lowest and so forth. Until we get to the marginal supplier and notice that the supplier on the margin earns no producer surplus at all. That is, this supplier, their costs are just basically equal to the price, they're not earning any producer surplus. Again, as with consumer surplus, remember that we can, and in fact we will be calculating these areas using our formula for the area of a triangle.
As with demand curves, supply curves can also shift. Let's look at an increase in supply first. Which way is this curve going to shift when we have an increase in supply. Keep in mind that the quantity is down here, so which way would be an increased quantity? It's like this. You might be a little confused at first because that's also down. But it's to the right and down. We can understand this a little bit better by thinking about exactly what it means. It means that at any given price, with the new supplier, with the increased supply, suppliers are now willing to supply a greater quantity. At the price of $10, using the old supply curve, they were willing to sell 20 units. At a price of $10 with the new supply curve with the increased supply, they're now willing to sell 80 units.
We can also understand an increase in supply using the vertical reading. What the increase in supply tells us is that for any quantity, suppliers are now willing to sell that quantity at a lower price. They used to need at least $10 per unit to sell this many units. Now they're willing to sell that same number of units at a lower price. So just thinking about this intuitively, can you guess what is the major factor that is going to increase supply? The major factor which is going to increase supply is a reduction in costs. That's why you can also understand this curve going down as costs fall. The reason supply increases is that costs are falling. So both of these directions should now make sense to you.
What about a decrease in supply? That of course, is just moving the supply curve in the opposite direction, moving it to the left and up. Again we can understand what this means. With the decrease in supply, it says that suppliers at the same price, they're now willing to sell a smaller quantity than they were before. At the same price, the quantity that they are willing and able to sell is going down, a decrease in supply. It also means that at the same quantity, suppliers now require a higher price to sell that quantity. With a decreased supply, suppliers require a higher price to sell the same quantity that they were supplying before. So what would make suppliers require a higher price to sell the same quantity? An increase in costs.
Let's look at this in a little bit more detail. I'm now going to give you a list of important supply shifters, but as with the demand shifters, the point here is not to memorize the list, the point is to understand that the major factor determining how supply shifts is a change in costs, that is, an increase in costs reduces the supply, a decrease in costs increases the supply. Our task now is just to understand how a whole bunch of factors, how do they change costs. Some of these are pretty obvious, for example, technological innovations or changes in input prices. A change in the price of the input of labor, that is a change in wages can change costs, the cost of production. Taxes and subsidies, expectations, the entry or exit of producers, changes in opportunity costs.
Some of these are a little bit harder to understand how they change cost. That's why in the next video, I'm going to go through each of them, and give you some examples, and step through them one by one. See you then.
Subtitles
- English
- Spanish
- Chinese
- Hindi
- French
- Arabic
Thanks to our awesome community of subtitle contributors, individual videos in this course might have additional languages. More info below on how to see which languages are available (and how to contribute more!).
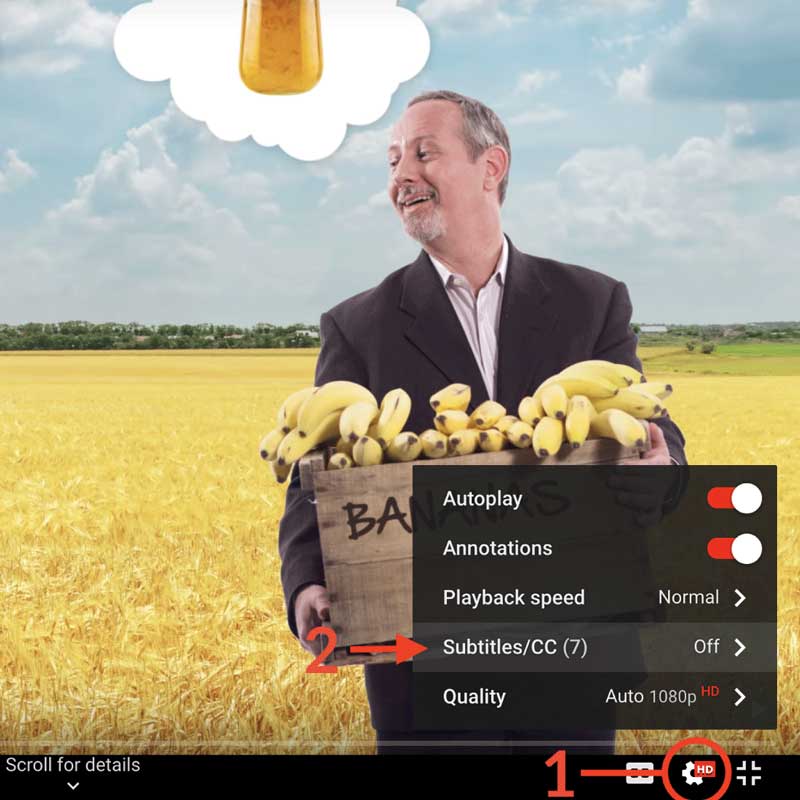
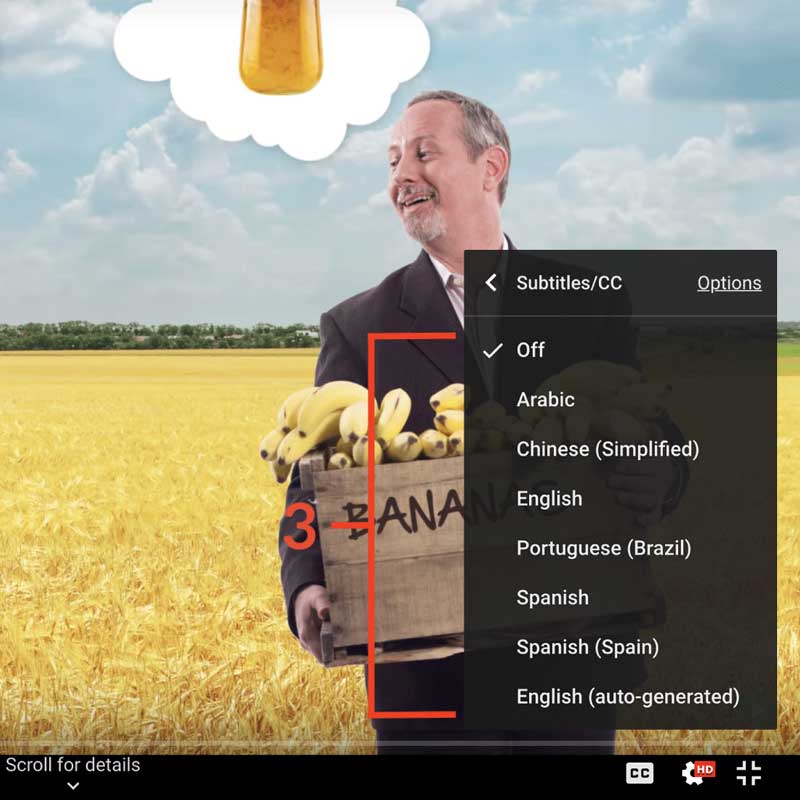
How to turn on captions and select a language:
- Click the settings icon (⚙) at the bottom of the video screen.
- Click Subtitles/CC.
- Select a language.


Contribute Translations!
Join the team and help us provide world-class economics education to everyone, everywhere for free! You can also reach out to us at [email protected] for more info.
Submit subtitles
Accessibility
We aim to make our content accessible to users around the world with varying needs and circumstances.
Currently we provide:
- A website built to the W3C Web Accessibility standards
- Subtitles and transcripts for our most popular content
- Video files for download
Are we missing something? Please let us know at [email protected]
Creative Commons

This work is licensed under a Creative Commons Attribution-NoDerivatives 4.0 International License.
The third party material as seen in this video is subject to third party copyright and is used here pursuant
to the fair use doctrine as stipulated in Section 107 of the Copyright Act. We grant no rights and make no
warranties with regard to the third party material depicted in the video and your use of this video may
require additional clearances and licenses. We advise consulting with clearance counsel before relying
on the fair use doctrine.


