The Long-Run Aggregate Supply Curve
Course Outline
The Long-Run Aggregate Supply Curve
We previously discussed how economic growth depends on the combination of ideas, human and physical capital, and good institutions. The fundamental factors, at least in the long run, are not dependent on inflation. The long-run aggregate supply curve, part of the AD-AS model we’ve been discussing, can show us an economy’s potential growth rate when all is going well.
The long-run aggregate supply curve is actually pretty simple: it’s a vertical line showing an economy’s potential growth rates. Combining the long-run aggregate supply curve with the aggregate demand curve can help us understand business fluctuations.
For example, while the U.S. economy grows at about 3% per year on average, it does tend to fluctuate quite a bit. What causes these fluctuations? One cause is “real shocks” that affect the fundamental factors of production. Droughts, changes to the oil supply, hurricanes, wars, technological changes, etc. can all have big and potentially far-reaching consequences.
Shocks are not all bad though! For instance, new technology can help boost economic growth. The key takeaway about real shocks is that economic growth, even in stable economies, is not smooth sailing.
Teacher Resources
Related to this course
See all Teacher Resources related to this course
Transcript
Last time, we introduced the aggregate demand curve. Today, we're going to add the long-run aggregate supply curve to our model. We're also going to show how real shocks can generate business fluctuations.
Let's bring back some familiar characters: "A", "L", and "K". Earlier we saw that the key to a country's economic growth was combining human and physical capital with ideas and good institutions. So, every economy has a potential growth rate, given by these fundamental factors. Now do any of these fundamental factors depend upon the rate of inflation? No -- at least not in the long run. The long-run aggregate supply curve shows an economy's potential growth rate when all is going well. Thus, the long-run aggregate supply curve -- it's very simple -- just a vertical line at the economy's potential growth rate, or "Solow" growth rate -- the rate given by the fundamental factors of growth.
That's the long run. We'll say more about the short run in a later video. We now have the aggregate demand curve, and the long-run aggregate supply curve. In this specific example, notice that spending is increasing at a rate of 10% per year, and the real economy is growing at 3% per year. So, inflation is 7% per year. How can we use this simple model to help us to understand business fluctuations? Let's revisit how the U.S. economy has grown over time. On average, it grows at a rate of about 3% per year. But there are lots of fluctuations around this average.
How come? One reason is that there are shocks to the key growth factors, shocks that continually buffet the economy. The supply of oil might leap up, or leap down. The weather can be an important positive or negative shock, especially in agricultural economies. We call shocks like this real shocks, because they directly affect how the factors of production are transformed into output. Even in developed economies, a bad hurricane, like Hurricane Sandy -- that can slow growth for a quarter or two.
It's hard to run a factory, for example, when the factory has been flooded. Even factories far from the center of the hurricane -- they may have to slow down if they can't get parts, for example. Wars, or big changes in taxes, or regulations, or other government policies, can also shock the economy, as can changes in ideas, or technology. Weather shocks are easy to see. But keep in mind that the fundamental forces that drive an economy -- they're not always operating in smooth ways. Some days while working in my office, for example, I have a good idea! And my research output? It leaps forward! And other days, I just can't seem to get anywhere, or produce anything. Sometimes, it's even negative production! Economic growth is like that.
Over time, ideas accumulate, and we do get progress. But it's not always a smooth process. Growth naturally comes in fits and starts. Real shocks in one area of the economy can also be amplified and transmitted to other areas of the economy. A shock to the banking sector, for example, can be amplified and transmitted to other sectors. And if the shocks are big enough -- yes, recessions, and even depression can be the result.
Now how would a real shock be represented in our AD-AS model? A negative shock shifts the long-run aggregate supply curve to the left, which lowers growth and increases the inflation rate. A positive shock shifts the long-run aggregate supply curve to the right, which increases growth and reduces the inflation rate. Of course, an economy -- it's experiencing lots of positive and negative shocks all the time. And over time, we'll see a process that looks like this.
So now we have one source of business fluctuations: real shocks. These are shocks that shift the long-run aggregate supply curve. In the next video, we're going to turn to a second source of shocks -- aggregate demand shocks, or what John Maynard Keynes called animal spirits.
Subtitles
- English
- Spanish
- Chinese
- Hindi
- French
- Arabic
Thanks to our awesome community of subtitle contributors, individual videos in this course might have additional languages. More info below on how to see which languages are available (and how to contribute more!).
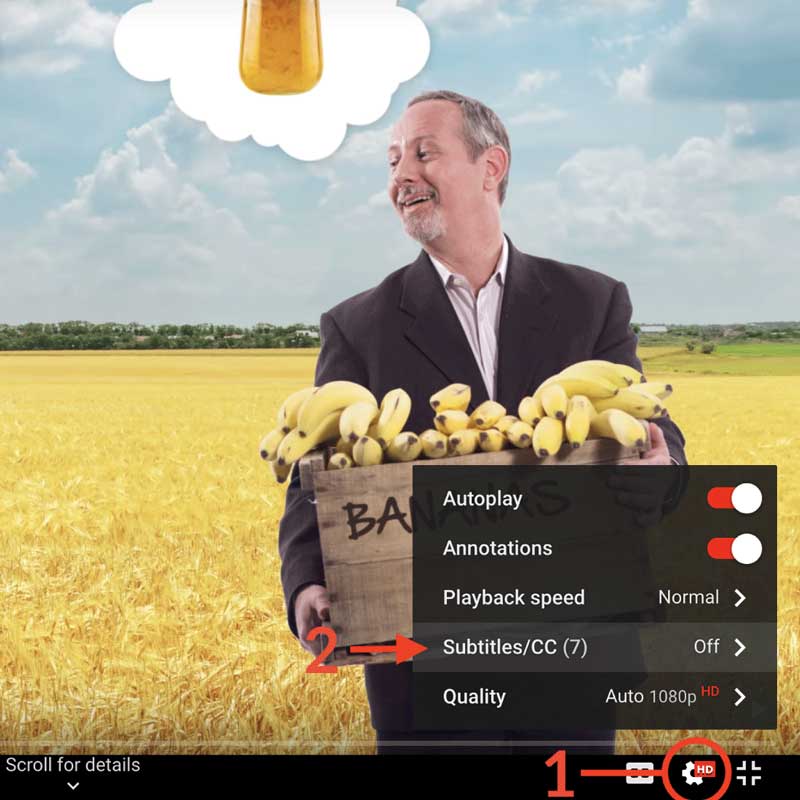
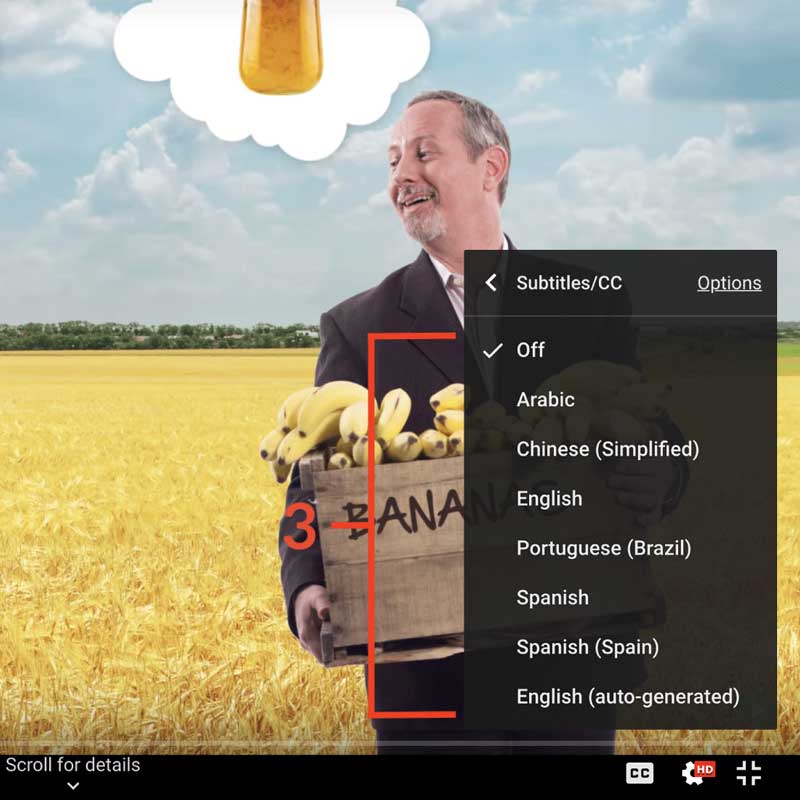
How to turn on captions and select a language:
- Click the settings icon (⚙) at the bottom of the video screen.
- Click Subtitles/CC.
- Select a language.


Contribute Translations!
Join the team and help us provide world-class economics education to everyone, everywhere for free! You can also reach out to us at [email protected] for more info.
Submit subtitles
Accessibility
We aim to make our content accessible to users around the world with varying needs and circumstances.
Currently we provide:
- A website built to the W3C Web Accessibility standards
- Subtitles and transcripts for our most popular content
- Video files for download
Are we missing something? Please let us know at [email protected]
Creative Commons

This work is licensed under a Creative Commons Attribution-NoDerivatives 4.0 International License.
The third party material as seen in this video is subject to third party copyright and is used here pursuant
to the fair use doctrine as stipulated in Section 107 of the Copyright Act. We grant no rights and make no
warranties with regard to the third party material depicted in the video and your use of this video may
require additional clearances and licenses. We advise consulting with clearance counsel before relying
on the fair use doctrine.

