Nominal vs. Real GDP
Course Outline
Nominal vs. Real GDP
"Are you better off today than you were 4 years ago? What about 40 years ago?"
These sorts of questions invite a different kind of query: what exactly do we mean, when we say “better off?” And more importantly, how do we know if we’re better off or not?
To those questions, there’s one figure that can shed at least a partial light: real GDP.
In the previous video, you learned how to calculate GDP. But that was a very particular kind of GDP: nominal GDP, which isn’t adjusted for inflation, and doesn’t account for increases in the population.
A lack of these controls produces a kind of mirage.
For example, compare the US nominal GDP in 1950. It was roughly $320 billion. Pretty good, right? Now compare that with 2015’s nominal GDP: over $17 trillion.
That’s 55 times bigger than in 1950!
But wait. Prices have also increased since 1950. A loaf of bread, which used to cost a dime, now costs a couple dollars. Think back to how GDP is computed. Do you see how price increases impact GDP?
When prices go up, nominal GDP might go up, even if there hasn’t been any real growth in the production of goods and services. Not to mention, the US population has also increased since 1950.
As we said before: without proper controls in place, even if you know how to compute for nominal GDP, all you get is a mirage.
So, how do you calculate real GDP? That’s what you’ll learn today.
In this video, we’ll walk you through the factors that go into the computation of real GDP.
We’ll show you how to distinguish between nominal GDP, which can balloon via rising prices, and real GDP—a figure built on the production of either more goods and services, or more valuable kinds of them. This way, you’ll learn to distinguish between inflation-driven GDP, and improvement-driven GDP.
Oh, and we’ll also show you a handy little tool named FRED — the Federal Reserve Economic Data website.
FRED will help you study how real GDP has changed over the years. It’ll show you what it looks like during healthy times, and during recessions. FRED will help you answer the question, “If prices hadn’t changed, how much would GDP truly have increased?”
FRED will also show you how to account for population, by helping you compute a key figure: real GDP per capita. Once you learn all this, not only will you see past the the nominal GDP-mirage, but you’ll also get an idea of how to answer our central question:
"Are we better off than we were all those years ago?"
Teacher Resources
Related to this course
See all Teacher Resources related to this course
Transcript
Is the economy growing? Are people better off today than they were four years ago? What about 40 years ago? The GDP statistic can help us to answer all of these questions. But first, we do need to make some modifications. As we discussed in our first video, GDP sums up the prices of all finished goods and services. So that means that there are two ways the GDP can increase.
First, prices can increase. In this case, the GDP number goes up, but the economy isn't actually producing more goods and services. It's inflation which is driving the higher GDP. The increase in GDP -- it might look good on paper -- but it's a mirage, a nominal increase only. The other way that GDP can increase is if we DO produce more valuable goods and services. That could mean simply more goods and services, or better goods and services, more highly-valued goods and services. It's this second type of increase in GDP that we want. This isn't a mirage, this is a real increase in GDP. Real GDP measures the second type of growth. And the Real GDP statistic -- it controls for inflation by adding up all the goods and services produced in an economy using the same set of prices over time.
The same set of prices. Real GDP tells us -- if, if the prices of goods and services hadn't changed, how much would GDP have increased, or decreased? Real GDP -- it's typically what we really care about. Let's give an example. We'll be using a fantastic tool called the St. Louis Federal Reserve Economic Database, or FRED. FRED is every economist's best friend. So, let's Google "US nominal GDP Fred." Here's what we get. We can see that we've grown from a GDP in 1950 of $320 billion, to a GDP in 2015 of over $17 trillion. Wow! That suggests that our economy has gotten 55 times bigger.
But hold on, hold on, wait a moment, you might say. My grandmother told me that a loaf of bread used to cost a dime. And now it costs a couple of dollars. That's right. If we want to compare our economy over time, we need to control for changes in prices. So, we don't want to look at Nominal GDP. We're more interested in Real GDP. So, let's Google "Real US GDP Fred." Here's what we get. This graph measures Real GDP in 2009 dollars. That means using 2009 prices. This graph tells us that using 2009 prices consistently, that in 1950, all the goods and services produced at that time were worth about $2 trillion.
In comparison, in 2015, all the goods and services produced at that time were worth about $16 trillion. So, while Nominal GDP says that the economy is 55 times bigger in 2015 than in 1950, Real GDP shows us that it's 8 times bigger. That's still pretty good, but a big difference between Nominal GDP and Real GDP. Okay. So now we've controlled for prices, but there's another big difference in the US economy in 1950 compared to today. Right - there's a lot more people today. We can control for the population size by using Real GDP per capita, or per person. By dividing Real GDP by a country's population, we get a good, albeit imperfect, measure of the average standard of living in a county.
So once again, let's Google, "Real GDP per capita FRED." Here's what we get. In 1950, Real GDP per capita, measured in constant prices, was about $14,000. In 2015, Real GDP per capita is about $50,000. So, on average, people in 2015 have a standard of living that's four times higher than the people in 1950. That's a pretty big and a remarkable increase in the standard of living. By the way, since Real GDP increased by eight times, and Real GDP per capita increased by four times, we know immediately that the population approximately doubled between 1950 and 2015.
Now let's take a closer look at this graph. We can see another reason why we're interested in the GDP statistic. Real GDP per capita declines during recessions. In fact, a decline in Real GDP is part of what defines a recession. Declines in Real GDP also tend to be accompanied by increases in unemployment. You can see here that when Real GDP dips, the unemployment rate spikes. Now here's another nice feature of the FRED database. On the Real GDP per capita graph, click "Edit data series" and then switch to percent annual changes. So now we can see immediately the annual changes in Real GDP. You can see, for example, the big recession in 2008 and 2009. In 2009, for example, the economy shrank by 3.6% compared to the year before. That's a very big and a very unpleasant decline.
Okay. So now you've got your hands around Real GDP as a way of measuring the health of our economy. And I said that Real GDP per capita is a good, albeit imperfect measure of the average standard of living in a country. But is that really true? Does an increase in Real GDP per capita mean that we're better off? That's the view that I'm going to defend in the next video.
Subtitles
- English
- Spanish
- Chinese
- Hindi
- French
- Arabic
Thanks to our awesome community of subtitle contributors, individual videos in this course might have additional languages. More info below on how to see which languages are available (and how to contribute more!).
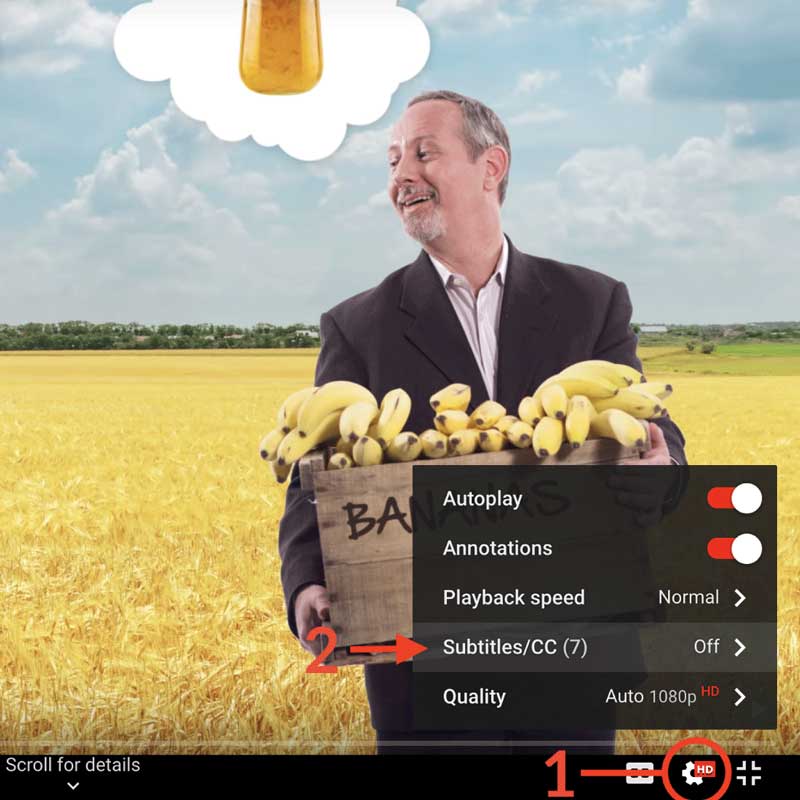
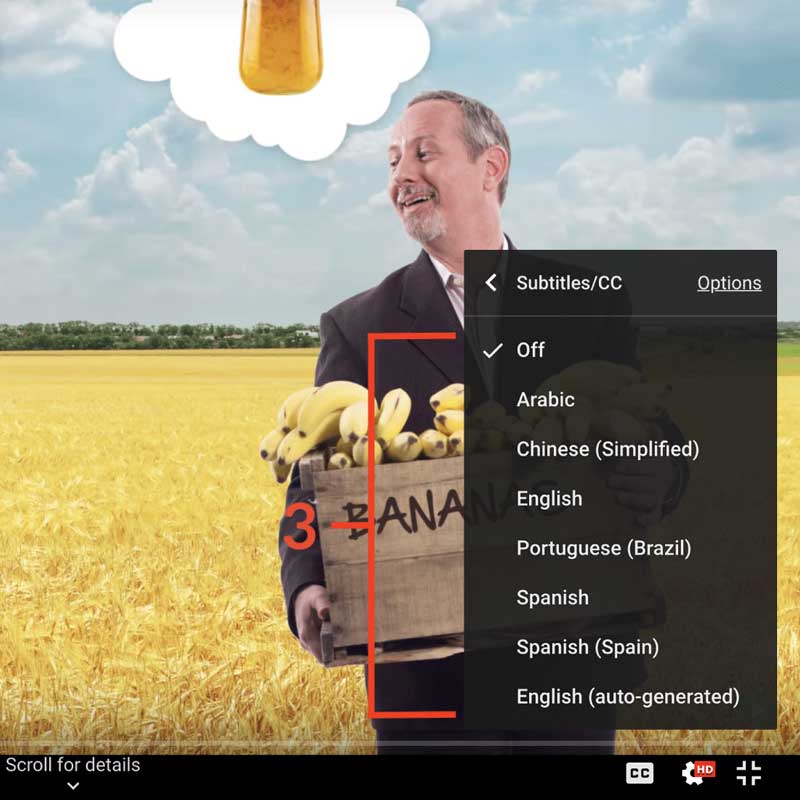
How to turn on captions and select a language:
- Click the settings icon (⚙) at the bottom of the video screen.
- Click Subtitles/CC.
- Select a language.


Contribute Translations!
Join the team and help us provide world-class economics education to everyone, everywhere for free! You can also reach out to us at [email protected] for more info.
Submit subtitles
Accessibility
We aim to make our content accessible to users around the world with varying needs and circumstances.
Currently we provide:
- A website built to the W3C Web Accessibility standards
- Subtitles and transcripts for our most popular content
- Video files for download
Are we missing something? Please let us know at [email protected]
Creative Commons

This work is licensed under a Creative Commons Attribution-NoDerivatives 4.0 International License.
The third party material as seen in this video is subject to third party copyright and is used here pursuant
to the fair use doctrine as stipulated in Section 107 of the Copyright Act. We grant no rights and make no
warranties with regard to the third party material depicted in the video and your use of this video may
require additional clearances and licenses. We advise consulting with clearance counsel before relying
on the fair use doctrine.


