The Short-Run Aggregate Supply Curve
Course Outline
The Short-Run Aggregate Supply Curve
In this video, we explore how rapid shocks to the aggregate demand curve can cause business fluctuations.
As the government increases the money supply, aggregate demand also increases. A baker, for example, may see greater demand for her baked goods, resulting in her hiring more workers. In this sense, real output increases along with money supply.
But what happens when the baker and her workers begin to spend this extra money? Prices begin to rise. The baker will also increase the price of her baked goods to match the price increases elsewhere in the economy. As prices increase, workers demand higher wages to be able to afford goods at a higher price.
In this example, the increase in money supply initially increased nominal and real wages for the baker and her employees, but as prices begin to rise, real wages begin to fall, and workers can afford less. Overtime, the demand for the baker’s goods will fall to pre-spending levels.
The takeaway? An increase in spending can increase output and growth in the short run, but not in the long run. To model this scenario, this video will show you how to draw a short-run aggregate supply curve. Let’s get started!
Teacher Resources
Related to this course
See all Teacher Resources related to this course
Transcript
In our previous video, we showed how real shocks can increase or decrease the growth rate. In this video, we're going to analyze how aggregate demand shocks -- rapid shifts in the AD curve -- how they can also lead to business fluctuations. Now, in the model so far, a shock to the AD curve, it can change the inflation rate but not the growth rate. That's a good prediction for the long run. In the long run, changes in spending -- they don't change the fundamental factors of growth, and so they won't change the long-run growth rate. But it's not a good prediction for the short run.
Let's recall the dynamic version of the quantity theory of money. Growth in the money supply plus growth in velocity equals inflation plus real growth. Or, more simply, spending growth equals inflation plus real growth. Economists believe that faster spending -- it doesn't flow immediately into an increase in inflation. And if inflation is slow to change, then according to our equation real growth must change. When spending increases, prices -- they don't move instantly. Prices, and especially wages, are sticky. And it takes time for them to react to a change in spending.
Let's give the intuition by returning to our inflation parable. In this parable, the government increases the supply of money, perhaps, as in Zimbabwe, by using newly printed money to pay for soldiers. The increase in the supply of money increases spending, an increase in aggregate demand. As in our parable, the baker, tailor, and the cabinet maker -- they're at first delighted to discover that the demand for their product has increased. To satisfy her new customers, the baker, for example -- she'll work extra hours, and perhaps she'll raise wages and hire more workers so that she can bake more bread. The tailor and the cabinet maker -- they'll respond in a similar way.
So real output increases. But we do know that an increase in the supply of money -- it doesn't increase the real factors of production. So as the baker and her workers spend the extra money, prices will start to rise. And the process will build on itself, because the banker finds that she must raise the price of bread to match the increase in prices elsewhere in the economy. And the same is true for the tailor, and the cabinet maker. At first, the increase in spending increased nominal and real wages.
But as prices rise, the real wage starts to fall. The workers find that their real wage -- it's not as high as they thought it was. And so, they'll no longer be willing to work so much overtime. Soon, the baker will return to baking the same quantity of bread that she did before. And the same will be true for the tailor and the cabinet maker. So, the increase in spending -- it increased output and growth in the short run, but not in the long run.
Okay. How do we model this? To capture some of these ideas, we're going to introduce into our diagram the short-run aggregate supply curve. Yeah, there are two supply curves. Let's begin with an example. Notice that in the initial equilibrium the inflation rate is 2%, and suppliers expect the inflation rate to be 2%, which we're going to note on the short-run aggregate supply curve by having "E" inflation, or E(pi) -- short for the expected inflation rate that's equal to 2%.
Now let's see how an increase in aggregate demand -- brought about by a faster growth rate in the money supply -- how it works its way through the economy. When the money supply starts to grow faster, the aggregate demand curve shifts out, and the economy expands along the short-run aggregate supply curve to point B. Notice that in the short run, the increase in aggregate demand increases the inflation rate and also the real growth rate as the bakers are starting to bake more bread. Pretty soon, however, the baker and her workers realize that although they were expecting an inflation rate of 2%, the actual inflation rate is 4%.
When workers see that prices are rising at a faster rate than they expected, they're going to demand higher wages. And, for the same reason, the miller who produces the flour for the bread -- he's going to raise his price. And now the baker will look around and think, "Since the flour that I need to bake my bread -- since it's gone up in price, I need to raise the price of my bread, just to stay even!"
As expectations adjust, the short-run aggregate supply curve will shift up, and to the left. The inflation rate increases, and the growth rate declines. In the long run, we'll end up at point C, with a higher inflation rate but the same long-run growth rate. Remember, a change in aggregate demand doesn't change the fundamental growth factors. So, in the long run, we must always end up on the long-run aggregate supply curve.
Now let's take a look at what happens when we have a negative shock to aggregate demand, a shift in the AD curve inwards. The economy begins at point A. If aggregate demand declines unexpectedly -- say because the money supply grows less quickly -- the new short-run equilibrium will be at point B, where the inflation rate is lower, and we have a much lower growth rate, perhaps even a negative growth rate, as shown here.
What's going on? When spending unexpectedly declines, businesses find that they're selling less. Businesses, therefore -- they'll cut back on their spending, and they'll hire fewer workers. Some businesses may even go out of business. Now, eventually, as the workers see that the inflation rate has declined, they'll be willing to accept lower wages or lower wage increases. And, eventually, we'll end up at a new long-run equilibrium at point C. But it takes time to get to point C. And in the meantime, the economy -- it's growing at less than its potential, and the unemployment rate -- it's too high. As John Maynard Keynes said, "In the long run, we're all dead!"
So, if we end up at point B, is there something that we can do to get the economy going again more quickly? Do we really have to wait for the long-run equilibrium at point C? That's the question that fiscal and monetary policy address. We'll be getting to that soon. But first, we need to spend a little bit more time talking about shifts in the aggregate demand curve. So far, we've focused on shifts in the money growth rate. In the next video, we'll say a bit more about shifts in the other component of aggregate demand: velocity, or "V." As we'll see, this is where animal spirits will make an appearance.
Subtitles
- English
- Spanish
- Chinese
- Hindi
- French
- Arabic
Thanks to our awesome community of subtitle contributors, individual videos in this course might have additional languages. More info below on how to see which languages are available (and how to contribute more!).
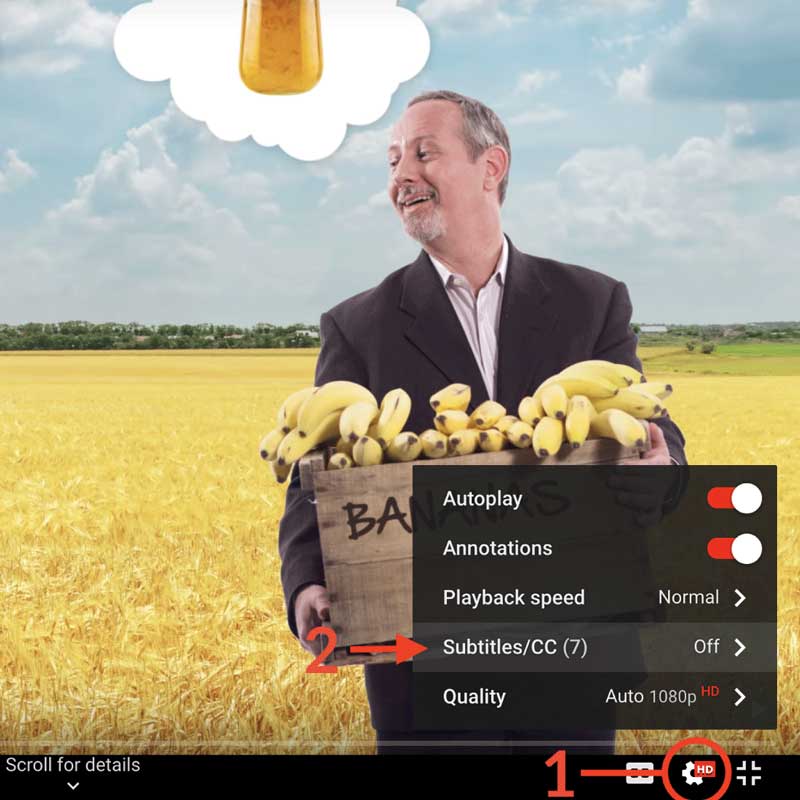
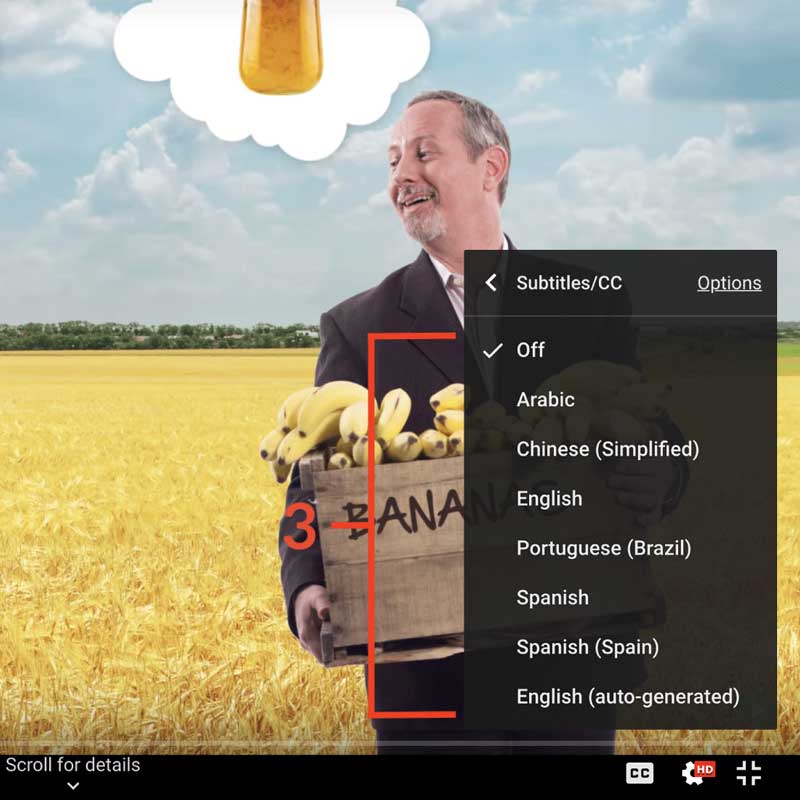
How to turn on captions and select a language:
- Click the settings icon (⚙) at the bottom of the video screen.
- Click Subtitles/CC.
- Select a language.


Contribute Translations!
Join the team and help us provide world-class economics education to everyone, everywhere for free! You can also reach out to us at [email protected] for more info.
Submit subtitles
Accessibility
We aim to make our content accessible to users around the world with varying needs and circumstances.
Currently we provide:
- A website built to the W3C Web Accessibility standards
- Subtitles and transcripts for our most popular content
- Video files for download
Are we missing something? Please let us know at [email protected]
Creative Commons

This work is licensed under a Creative Commons Attribution-NoDerivatives 4.0 International License.
The third party material as seen in this video is subject to third party copyright and is used here pursuant
to the fair use doctrine as stipulated in Section 107 of the Copyright Act. We grant no rights and make no
warranties with regard to the third party material depicted in the video and your use of this video may
require additional clearances and licenses. We advise consulting with clearance counsel before relying
on the fair use doctrine.

