Office Hours: Using the AD-AS Model
Course Outline
Office Hours: Using the AD-AS Model
We’re going to explore the mechanics of the aggregate-demand aggregate-supply (AD-AS) model. In our example, we’ll measure the economy’s inflation rate as well as the real GDP growth rate on the vertical and horizontal axes.
A country’s normal GDP growth rate is represented by the vertical line known as the long-run aggregate supply (LRAS) curve. Why is it vertical? Well, an economy’s long-run growth rate depends on the fundamental factors of production rather than nominal factors, like inflation. If there are no changes to the fundamental factors, the economy will tend to return to this level of economic growth over a long enough timeline. Think of the LRAS curve as the “North Star” of economic growth.
Now the aggregate demand (AD) curve is affected by inflation. We use the quantity theory of money to derive it. The AD curve shows any combination of the inflation rate plus the real GDP growth rate that add up to a constant amount (this is also the growth rate of nominal GDP).
Finally, we also have the short-run aggregate supply (SRAS) curve. Even if the economy tends to return to the LRAS level over time, real economic growth can slow down for a little while – such as during a recession. The SRAS helps us show these scenarios.
In the video, we’ll dive into the factors that cause these curves to shift on the graph and what this model can tell us about the economy.
Teacher Resources
Related to this course
See all Teacher Resources related to this course
Transcript
Today we're going to do a deep dive into the mechanics of the aggregate demand--aggregate supply model so that we understand what all the curves and notation mean. Let's start at the beginning.
What are we actually measuring in this economy? On the vertical axis, we'll measure the economy's inflation rate denoted by the Pi symbol. This is the percentage change in an economy's average price level in a given year. And on the horizontal axis, we'll track the economy's real GDP growth rate. But before we get into the causes of the booms and the busts of an economy, we have to know what the economy's normal GDP growth rate is, right?
That's the long-run aggregate supply curve. It's the vertical line, because an economy's long-run growth rate shouldn't depend on inflation. Instead, it should depend on the fundamental factors of production -- technology, capital, and labor. So we can treat the LRAS curve like the North Star of economic growth. The economy will tend to return to this level of economic growth over time, assuming no changes in the fundamentals.
Now let's derive the aggregate demand curve from the quantity theory of money. Recall that the money growth rate plus velocity growth rate equals inflation rate plus real GDP growth rate. The AD curve is all the combinations of the inflation rate and the real growth rate that add up to a constant amount. So, for example, say money growth is 4% and velocity is 1%, for a total of 5%. Then any combination of inflation and real GDP growth must add to 5%.
Alternatively, since the inflation rate plus the growth rate of real GDP is the growth rate of nominal GDP, we can also say that the AD curve shows all the combinations of inflation and real growth which give the same growth rate of nominal GDP.
So how does the AD curve shift? The AD curve will shift if there's a change in the money growth rate, "M," or the change in velocity growth, "V." The central bank affects money growth. Government spending, and consumer and investor confidence can effect velocity growth. So we have our supply and demand curve, but we also need a short-run supply curve that looks like this.
Let's dig in to why we need a short-run supply curve. Suppose that the government slows down the growth rate of the money supply such that AD shifts to the left, like this. The fundamental factors of production haven't changed, so in the long run we'll move to point C. But notice that at point C the inflation rate is lower than at point A. Unfortunately, it's difficult for the economy to move from A to C without reducing real growth in the short run. Why is that? Because prices and wages are sticky.
Imagine that your boss came into your office one day and just says, "Hey, the central bank is slowing money growth, so you won't be getting a raise this year." You'd probably be pretty upset -- even if your boss told you that since prices will also be lower you won't be worse off. Similarly, imagine that you told your boss that you thought the firm shouldn't raise prices this year because the growth rate of the money supply had fallen. Your boss might complain that she has to raise prices because her input prices are still increasing.
In theory, if workers and firms all agree to lower wages and prices at once -- kind of like we sometimes agree to change the clocks at the same time -- we could move to point C quickly. But it's just not that easy to coordinate an entire economy in this way. Since wages and prices don't all move at once, it takes time to adjust to our new equilibrium, and the adjustment process creates a painful reduction in the growth rate of real GDP. So, in the short run, we move from point A to point B. Now eventually we'll get back to our North Star growth, but it will take time for everyone to recognize that lower inflation rate, and adjust their wage and price demands appropriately.
Now when we finally do return to our long-run equilibrium at point C, everyone will now expect that newer lower rate of inflation as denoted by the Pi equals 2%, which means workers and firms now expect an inflation rate of 2%, and make their decisions based on that expectation rather than the previous expected inflation rate of 4%. So we can also say that short-run recession occurs because at point A people are planning and making decisions, expecting that an inflation would be 4%, and when that expectation turns out to be false, it takes time to adjust those plans, decisions, and expectations to the new inflation rate of 2%.
Now, it's important to realize that this is just a model, and a model tells us things like, "if x happens, then y will happen," or, "if q happens, then z will happen." But by itself, the model doesn't tell us if q or x are happening. For example, the Great Recession was, in part, caused when housing prices fell dramatically, causing people to cut back on their spending -- a fall in the growth rate of V. Now the model tells us what to expect when V falls, but it takes time to figure out that that was actually going on in 2008 and 2009.
Subtitles
- English
- Spanish
- Chinese
- Hindi
- French
- Arabic
Thanks to our awesome community of subtitle contributors, individual videos in this course might have additional languages. More info below on how to see which languages are available (and how to contribute more!).
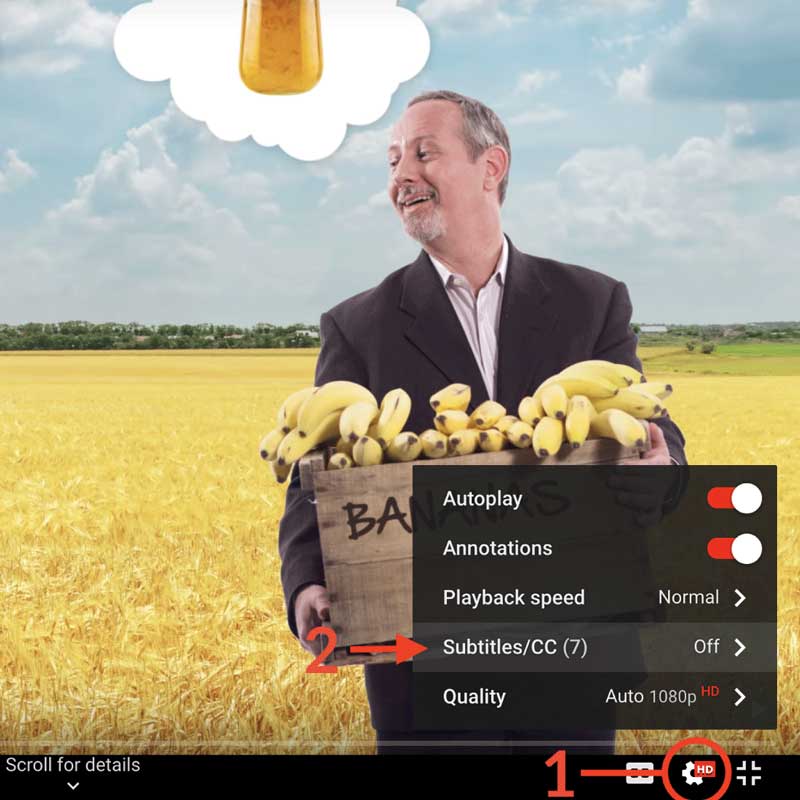
How to turn on captions and select a language:
- Click the settings icon (⚙) at the bottom of the video screen.
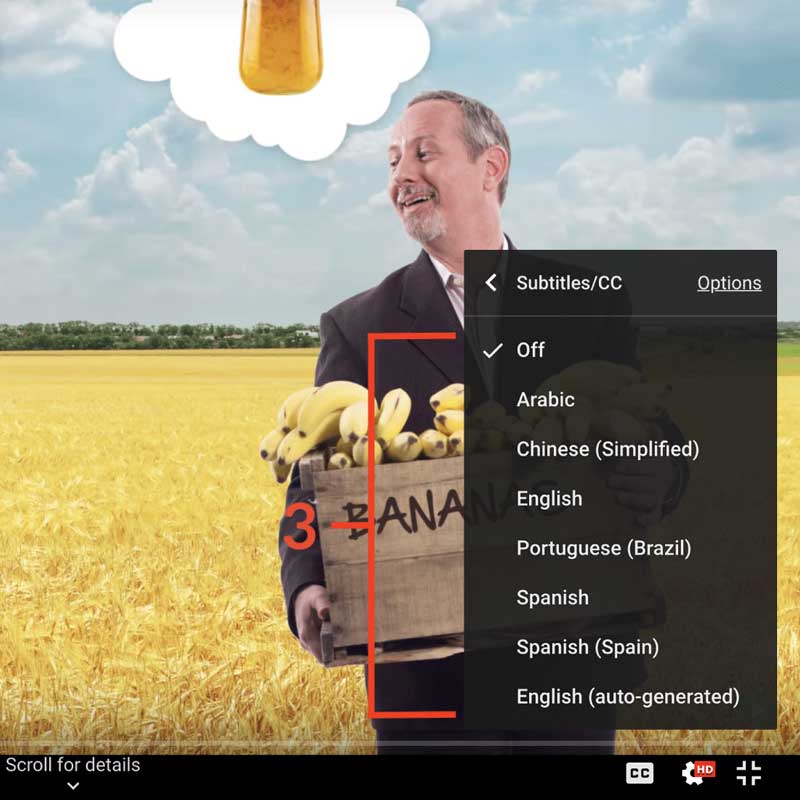
- Click Subtitles/CC.
- Select a language.


Contribute Translations!
Join the team and help us provide world-class economics education to everyone, everywhere for free! You can also reach out to us at [email protected] for more info.
Submit subtitles
Accessibility
We aim to make our content accessible to users around the world with varying needs and circumstances.
Currently we provide:
- A website built to the W3C Web Accessibility standards
- Subtitles and transcripts for our most popular content
- Video files for download
Are we missing something? Please let us know at [email protected]
Creative Commons

This work is licensed under a Creative Commons Attribution-NoDerivatives 4.0 International License.
The third party material as seen in this video is subject to third party copyright and is used here pursuant
to the fair use doctrine as stipulated in Section 107 of the Copyright Act. We grant no rights and make no
warranties with regard to the third party material depicted in the video and your use of this video may
require additional clearances and licenses. We advise consulting with clearance counsel before relying
on the fair use doctrine.


