Basic Facts of Wealth
Course Outline
Basic Facts of Wealth
We know that there are rich countries, poor countries, and countries somewhere in between. Economically speaking, Japan isn’t Denmark. Denmark isn’t Madagascar, and Madagascar isn’t Argentina. These countries are all different.
But how different are they?
That question is answered through real GDP per capita—a country’s gross domestic product, divided by its population.
In previous videos, we used real GDP per capita as a quick measure for a country’s standard of living. But real GDP per capita also measures an average citizen’s command over goods and services. It can be a handy benchmark for how much an average person can buy in a year -- that is, his or her purchasing power. And across different countries, purchasing power isn’t the same.
Here comes that word again: it’s different.
How different? That’s another question this video will answer.
In this section of Marginal Revolution University’s course on Principles of Macroeconomics, you’ll find out just how staggering the economic differences are for three countries—the Central African Republic, Mexico, and the United States.
You’ll see why variations in real GDP per capita can be 10 times, 50 times, or sometimes a hundred times as different between one country and another. You’ll also learn why the countries we traditionally lump together as rich, or poor, might sometimes be in leagues all their own.
The whole point of this? We can learn a lot about a country’s wealth and standard of living by looking at real GDP per capita.
But before we give too much away, check out this video -- the first in our section on The Wealth of Nations and Economic Growth.
Teacher Resources
Related to this course
See all Teacher Resources related to this course
Transcript
We all know that there are rich countries and poor countries. The United States? It's one of the richest countries in the world with one of the highest standards of living. The Central African Republic is one of the poorest countries in the world. Mexico? It's somewhere in between. But just how big are these differences between the rich and the poor countries? And how do we measure these differences? We're going to measure the differences in living standards by looking at Real GDP per capita. That's a country's Gross Domestic Product divided by its population. Real GDP per capita captures the average individual's command over goods and services their purchasing power. Or, put another way, how much stuff, which we'll picture here using a basket of groceries, can an average person buy in a year?
So, let's start with the Central African Republic. This is a small, landlocked nation in Africa. It's currently suffering under a civil war. It's probably the poorest country in the world. In the CAR, an average person can buy just six baskets of stuff in a year. Now let's consider Mexico, a country you might be a little bit more familiar with. If the average person in the CAR - if they can buy six baskets of goods in a year, how many baskets do you think that the average person in Mexico can buy? Take a moment, take a guess, make a mental note of it. We'll come back to that.
Now let's look at the largest of the developed nations, the United States. How many baskets of goods do you guess that the average American can buy in a year? Okay, have you got your guesses? Here are the answers. In our depiction, each basket is worth $100 of buying power per year. Using data from the International Monetary Fund, Real GDP per capita -- in the Central African Republic -- it's about $600 per year. Just six baskets. Real GDP per capita in Mexico, in contrast, is $17,800 per year. Or 178 baskets. Both of these numbers, by the way, have been converted to dollars by taking into account differences in prices in these countries. These are so-called purchasing power parity conversions -- the most accurate way we know to compare living standards across different countries.
Now let's look at Mexico and the CAR again. The average person in Mexico -- they can buy 29 times as much stuff in a year as the average person in the Central African Republic. What about the average American? Well, this is how much the average American can buy -- baskets. That's three times more than the average person in Mexico, and 90 times more than the average person in the Central African Republic. So, when we're talking about differences in wealth between countries -- these are not small differences -- but regularly, on the order of 10, 20, 50, sometimes 100 times more in one country than in another. And countries that we might sometimes lump together in our mind as being poor, like Mexico and the Central African Republic -- they're not nearly in the same league. The prosperity in Mexico -- it's much closer to the United States than it is to the truly destitute nations, such as the Central African Republic.
These huge disparities in wealth, have they always existed? Are countries converging? Are they diverging? Is it getting better or worse? Are some countries catching up? These are all topics of some of our upcoming videos, so get ready to dig in.
Subtitles
- English
- Spanish
- Chinese
- Hindi
- French
- Arabic
Thanks to our awesome community of subtitle contributors, individual videos in this course might have additional languages. More info below on how to see which languages are available (and how to contribute more!).
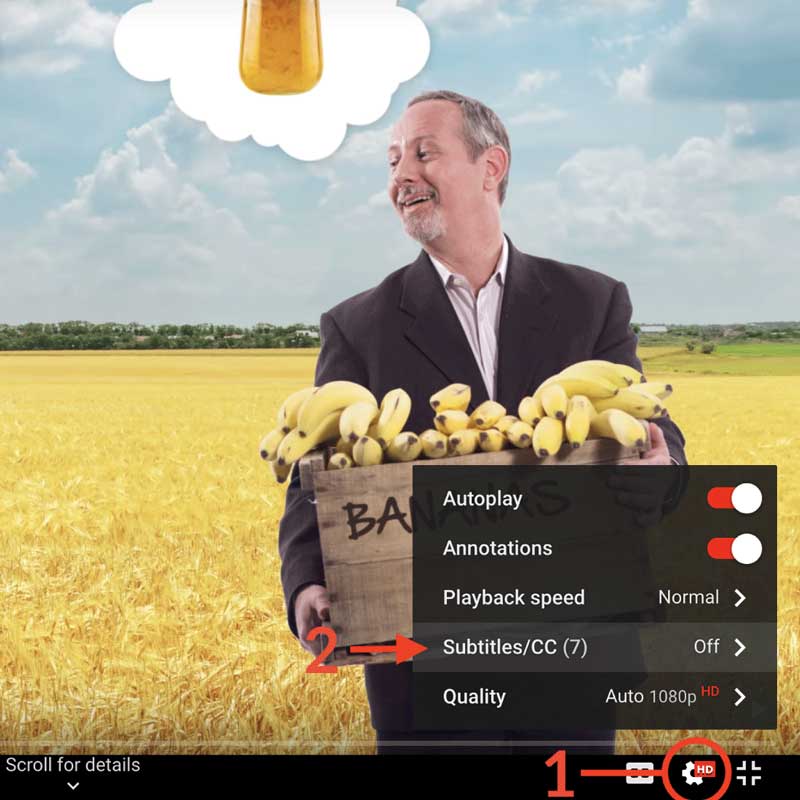
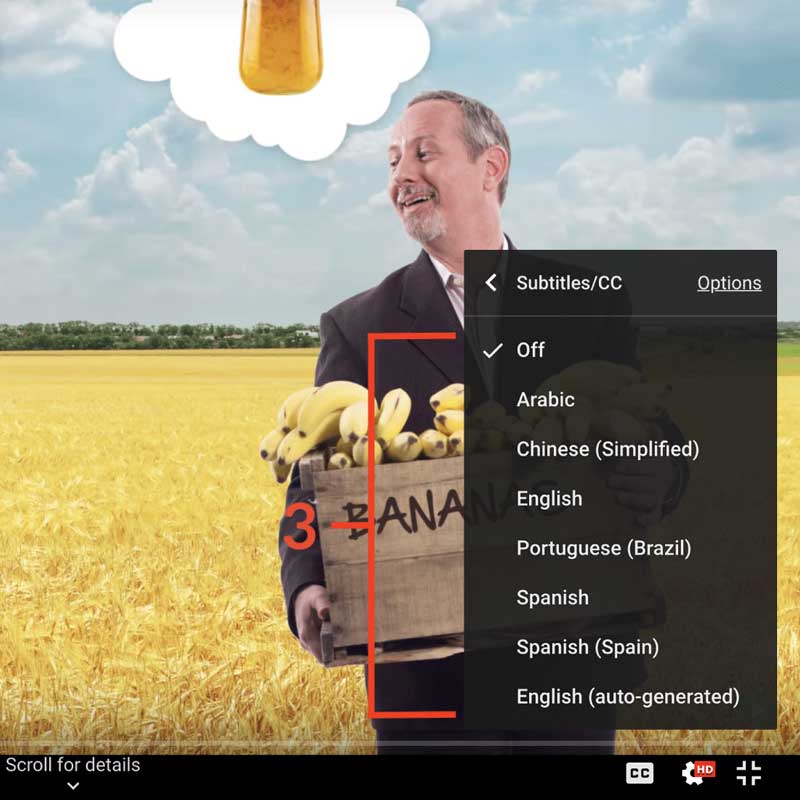
How to turn on captions and select a language:
- Click the settings icon (⚙) at the bottom of the video screen.
- Click Subtitles/CC.
- Select a language.


Contribute Translations!
Join the team and help us provide world-class economics education to everyone, everywhere for free! You can also reach out to us at [email protected] for more info.
Submit subtitles
Accessibility
We aim to make our content accessible to users around the world with varying needs and circumstances.
Currently we provide:
- A website built to the W3C Web Accessibility standards
- Subtitles and transcripts for our most popular content
- Video files for download
Are we missing something? Please let us know at [email protected]
Creative Commons

This work is licensed under a Creative Commons Attribution-NoDerivatives 4.0 International License.
The third party material as seen in this video is subject to third party copyright and is used here pursuant
to the fair use doctrine as stipulated in Section 107 of the Copyright Act. We grant no rights and make no
warranties with regard to the third party material depicted in the video and your use of this video may
require additional clearances and licenses. We advise consulting with clearance counsel before relying
on the fair use doctrine.


