Changes in Velocity
Course Outline
Changes in Velocity
What happens when aggregate demand shifts because of a change in the velocity of money? You’ll recall from earlier videos that an increase or decrease in velocity means that money is changing hands at a faster or slower rate.
Changes in velocity are temporary, but they can still cause business fluctuations. For instance, say that consumption growth slows as consumers become pessimistic about the economy.
In fact, we saw this play out in 2008, when workers and consumers became afraid that they might lose their jobs during the Great Recession. This fear drove them to cut back on their spending in the short run. But, since changes in velocity are temporary, this fear receded as time passed and the economy began to recover.
Dive into this video to learn more about what causes shifts in the aggregate demand curve.
Teacher Resources
Related to this course
See all Teacher Resources related to this course
Transcript
Welcome back to the aggregate demand - aggregate supply model. In the previous video, we focused on what happens when the aggregate demand curve shifts due to a change in the money growth rate. Now we're going to ask what happens when AD shifts because of a change in "V". This time, we'll assume the money supply is constant. You can think of velocity as how often money changes hands. So, an increase in V means that spending has increased because money is changing hands at a faster rate. It's useful to recall the National Income Spending Identity -- Y = C + I + G + NX.
Now all this does -- it just breaks spending down into different categories. So, if V changes, then the growth rate of either C, or I, or G, or NX must change. For example, suppose that the government starts spending a lot more -- say a big increase in defense spending. The increase in spending shifts out the aggregate demand curve. So, in the short run, the economy moves from point A to point B, creating a higher growth rate, a boom from all that defense spending, and also a higher inflation rate, as that spending pushes up prices.
That's the short run. Now, what happens in the long run? Well, in the long run, government spending growth has to return to normal. Government can't keep growing spending at a higher rate forever, because, in the long run, government spending can't grow faster than the economy grows. So, in the long run, the aggregate demand curve shifts back, as the growth rate of government spending returns to normal. So, after the boost in spending works its way through the economy, we return to point A. So, changes in M and V shift the aggregate demand curve in slightly different ways.
The money supply growth rate can be increased or decreased permanently, but changes in V are always temporary. The best way to remember this is that, in the long run, we have to be on the long-run aggregate supply curve. And, in addition, in the long run, the inflation rate is determined by the money supply growth rate. So, if the money supply growth rate hasn't changed, then the inflation rate can't change in the long run either. Now even though changes in V are always temporary -- an increase in V shifts the AD curve out, and then back. A decrease in V shifts the AD curve in, and then back. Even though these changes are temporary, they can still cause business fluctuations. And if the changes are big and very negative, these changes can even create a recession.
Let's illustrate with another example. Suppose that "C," consumption growth, decreases. Now why might this happen? Fear. Imagine that consumers suddenly become pessimistic and fearful about the economy, as they did in 2008, when it looked like the banking system was on the edge of collapse. Workers and consumers, fearing that they might lose their jobs -- they cut back on their spending. They try to hold onto their money. Instead of buying a new car, they hold onto their old car. They decide that now is not a good time to remodel the kitchen. They start saving more money -- just in case. The "animal spirits" -- to use John Maynard Keynes' famous phrase -- they've "turned negative." The decrease in consumption growth shifts the AD curve inwards.
In the short run, the decrease in spending moves the economy from point A to point B, where inflation and real growth are both reduced. In the long run, however, fear recedes, prices and wages adjust, and the economy moves back to point A. Now, by the way, if you're thinking, "Why don't we try to offset the fall in C with an increase in G?" Good thinking! That's the idea behind fiscal policy, which we'll take up in greater depth in a later video in this course.
For now, let's sum up. Let's review some of the causes of the shifts in the AD curve. Since M is money supply growth, and V can be broken down into C, I, G, or NX, the causes boil down to anything that can affect these factors. So, for example, faster money growth shifts the AD curve outwards. Slower money growth, especially slower than expected -- that shifts the AD curve in. For consumption, confidence and fear -- that could increase or decrease consumption growth. Confidence and fear -- animal spirits -- these are also big drivers of investment. Big changes in tax rates could have similar effects, with lower taxes increasing spending, and higher taxes reducing spending.
As we've already discussed, increases in government spending shift the AD curve out, and decreases in government spending shift the AD curve in. Finally, since NX is equal to exports minus imports, an export boom would increase domestic aggregate demand, as would a cut in imports. For the same reasons, a decrease in exports, or a boom in imports, would reduce domestic spending, and shift the AD curve in.
Now don't try and memorize this list. As always, it's better to understand the logic. Forces that increase spending -- that shifts the AD curve out. It causes a positive shock to the economy. Forces that decrease spending -- that shifts the AD curve in, and causes a temporary negative shock to the economy. Okay. That's our aggregate demand-aggregate supply model. We can now use the model to understand the most devastating economic fluctuation in U.S. history: the Great Depression.
Subtitles
- English
- Spanish
- Chinese
- Hindi
- French
- Arabic
Thanks to our awesome community of subtitle contributors, individual videos in this course might have additional languages. More info below on how to see which languages are available (and how to contribute more!).
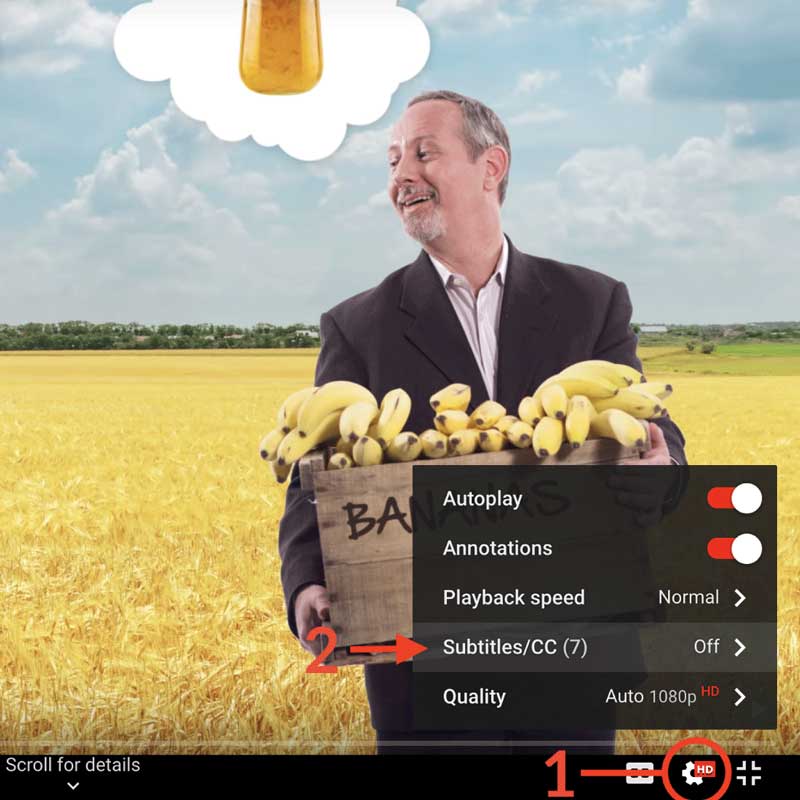
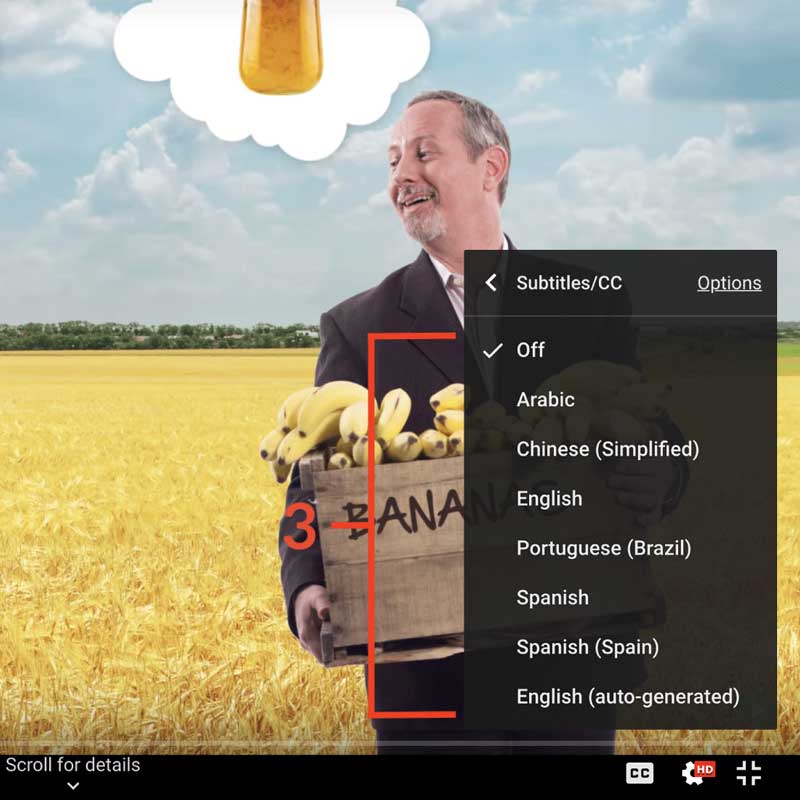
How to turn on captions and select a language:
- Click the settings icon (⚙) at the bottom of the video screen.
- Click Subtitles/CC.
- Select a language.


Contribute Translations!
Join the team and help us provide world-class economics education to everyone, everywhere for free! You can also reach out to us at [email protected] for more info.
Submit subtitles
Accessibility
We aim to make our content accessible to users around the world with varying needs and circumstances.
Currently we provide:
- A website built to the W3C Web Accessibility standards
- Subtitles and transcripts for our most popular content
- Video files for download
Are we missing something? Please let us know at [email protected]
Creative Commons

This work is licensed under a Creative Commons Attribution-NoDerivatives 4.0 International License.
The third party material as seen in this video is subject to third party copyright and is used here pursuant
to the fair use doctrine as stipulated in Section 107 of the Copyright Act. We grant no rights and make no
warranties with regard to the third party material depicted in the video and your use of this video may
require additional clearances and licenses. We advise consulting with clearance counsel before relying
on the fair use doctrine.

