Supply Curve
Course Outline
Supply Curve
Supply Curve: A graph that shows the quantity supplied of a given good at different prices. This is from the video “The Supply Curve” in the Principles of Microeconomics course.
Teacher Resources
Transcript
Now that we've got the demand curve down, let's move on to the supply curve. A supply curve shows how much of a good suppliers are willing and able to supply at different prices. As with the demand curve, there's a supply curve for every good and service. And again the ideas are the same, so let's look at the supply curve for oil.
We see an intuitive relationship between price and the quantity supplied. As the price goes up, the quantity of oil that companies are willing to supply increases. In this example, in a low price, $5 per barrel, let's say 10 million barrels of oil are supplied per day. At $20 per barrel, 25 million barrels are supplied, and at $55 per barrel, 50 million barrels are supplied. So in general, a higher price means a greater quantity supplied.
Let's delve deeper and see why. Oil exists all over the world, but it's not equally easy to extract. In some places like Saudi Arabia, it's really easy to get oil out of the ground. It's costs about $2 a barrel to extract. Oil in the US, like from Alaska, is a lot deeper and getting it out cost more, at least $10 per barrel. And producing oil from an oil rig, like the Atlantis rig in the Gulf Coast, is even more expensive. That rig has to descend more than a mile underwater before drilling even begins.
When oil prices are relatively low, the only suppliers that can turn a profit are those who can get to the oil cheaply, like Saudi Arabia. As the price goes up, other suppliers in Nigeria, Russia, and Alaska, who have higher extraction costs, start to become profitable so they can enter the market. As the price gets higher, even the most expensive extraction techniques become profitable. The supply curve slopes upward because the only way the quantity of oil can be increased is to exploit higher and higher cost sources of oil. As the price of oil goes up, the depth of the oil wells goes down. With this simple line the supply curve summarizes the way suppliers respond to a change in price including how suppliers will enter and exit the market depending on the price.
So far, we've said things like if the price goes down, buyers will want to buy more or if the price rises, suppliers will want to sell more. But we haven't said anything about how prices are determined. That's the subject for the next video, Equilibrium.
Subtitles
Thanks to our awesome community of subtitle contributors, individual videos in this course might have additional languages. More info below on how to see which languages are available (and how to contribute more!).
How to turn on captions and select a language:
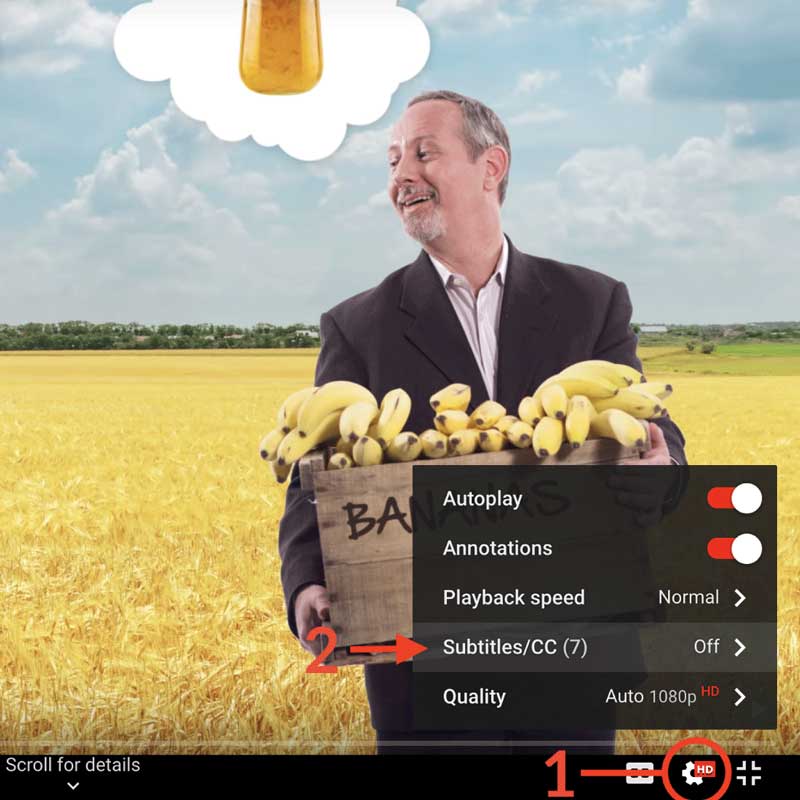
- Click the settings icon (⚙) at the bottom of the video screen.
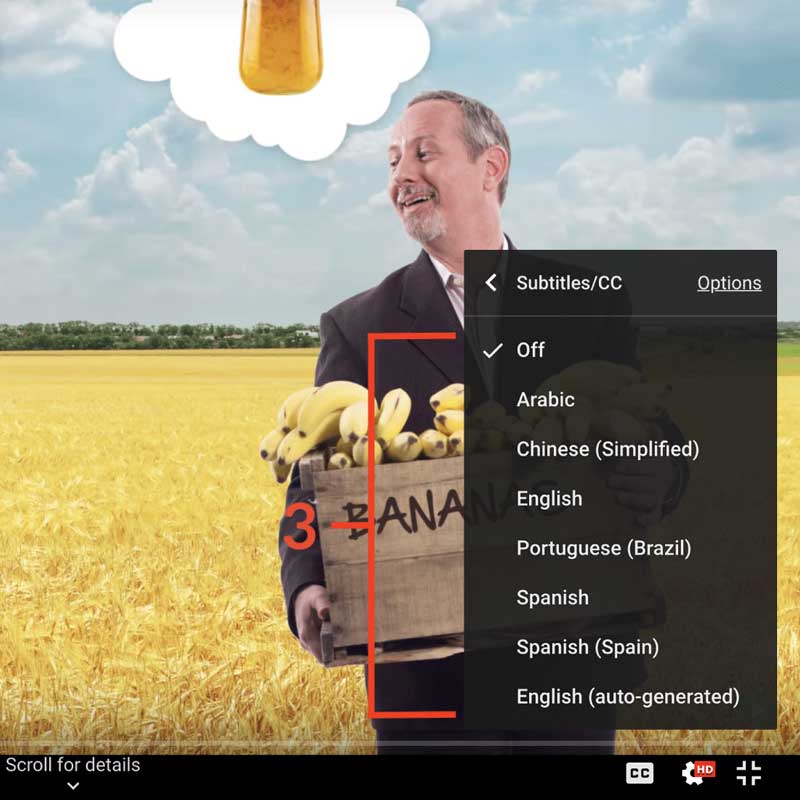
- Click Subtitles/CC.
- Select a language.


Contribute Translations!
Join the team and help us provide world-class economics education to everyone, everywhere for free! You can also reach out to us at [email protected] for more info.
Submit subtitles
Accessibility
We aim to make our content accessible to users around the world with varying needs and circumstances.
Currently we provide:
- A website built to the W3C Web Accessibility standards
- Subtitles and transcripts for our most popular content
- Video files for download
Are we missing something? Please let us know at [email protected]
Creative Commons

This work is licensed under a Creative Commons Attribution-NoDerivatives 4.0 International License.
The third party material as seen in this video is subject to third party copyright and is used here pursuant
to the fair use doctrine as stipulated in Section 107 of the Copyright Act. We grant no rights and make no
warranties with regard to the third party material depicted in the video and your use of this video may
require additional clearances and licenses. We advise consulting with clearance counsel before relying
on the fair use doctrine.
