Aggregate Demand
Course Outline
Aggregate Demand
This is "The Aggregate Demand Curve" from our Principles of Economics: Macroeconomics course.
The aggregate demand-aggregate supply model, or AD-AS model, can help us understand business fluctuations. We’ll start exploring this model by focusing on the aggregate demand curve.
The aggregate demand curve shows us all of the possible combinations of inflation and real growth that are consistent with a specified rate of spending growth. The dynamic quantity theory of money (M + v = P + Y) can help us understand this concept. Let’s recap the variables:
M = growth rate of the money supply
v = growth in velocity (or how quickly a dollar changes hands)
P = growth rate of prices (inflation)
Y = growth rate of real GDP
If we rewrite the equation slightly to M + v = inflation + real growth, you can think of the left side as “spending growth.”
Now let’s try out an example scenario. Suppose the growth of the money supply has been 5% and the growth in velocity has been 0%. If real GDP growth has been at 0%, you’ll get 5% + 0% = inflation + 0%. To make the sides equal, inflation must be 5%. This is one combination of inflation and real growth that is consistent with the spending growth of 5%. But there are many other possible combinations. For example, if real growth had been 3% instead of 0%, inflation would be at 2%.
Try plotting these points on a graph with inflation on the y-axis and real growth on the x-axis and connect them with a line. You’re drawing an aggregate demand curve!
Put simply, the aggregate demand curve connects all of the points on a graph that show us all of the possible combinations of inflation and real growth that are consistent with spending growth.
You can think about spending growth another way, too. It’s actually the equivalent of nominal GDP growth. If nominal GDP growth is 5%, an AD curve shows all of the possible combinations of inflation and real GDP growth that add up to 5% nominal GDP growth. Likewise, if nominal GDP growth is 7%, the AD curve will show all of the possible combinations of inflation and real GDP growth that add up to 7%, and so on. Increases in the growth rate of nominal GDP shift the aggregate demand curve outwards, whereas decreases shift it inwards.
Teacher Resources
Transcript
The aggregate demand-aggregate supply model is a good starting point for understanding business fluctuations. Let's begin by learning about the aggregate demand, or AD curve. The aggregate demand curve shows us all the combinations of inflation and real growth that are consistent with a specified rate of spending growth.
The easiest way to explain this is to remember from our discussions of the quantity theory of money that we can write the quantity theory in dynamic form, like this: "M" is the growth rate of the money supply. "V" is growth and velocity, or how quickly a dollar is changing hands. "P" is the growth rate of prices, and we have another name for the growth rate of prices -- that's the inflation rate, which we'll also write as pi. And "YR" is the growth rate of real GDP. So, let's just rewrite our equation very slightly as M + V is equal to inflation plus real growth. So, the left-hand side is spending growth, while the right-hand side is inflation plus real growth.
Let's give an example of how this equation works. Suppose the money supply is growing at a rate of 5% per year - M is 5%. And let's suppose that V is constant at 0%, and real growth is 0%. Then we have that 5% plus 0% is equal to inflation plus 0%. So, it follows that the inflation rate is 5%. Thus, one combination of inflation and real growth that's consistent with a spending growth rate of 5% is 5% inflation and 0% real growth. But there are lots of other combinations of inflation and real growth that are also consistent with a 5% rate of spending growth. For example, 3% real growth and 2% inflation.
Now let's do what economists always do, we'll do a graph. We're going to put inflation on the vertical axis, and real growth on the horizontal axis. And let's suppose that spending growth is 5%. An aggregate demand curve shows us all the combinations of inflation and real growth, consistent with a specified rate of spending growth. We just presented two points that are consistent with a spending growth rate of 5%, namely 5% inflation and 0% real growth, and also 2% inflation and 3% real growth. Connecting these two points we have an aggregate demand curve, a curve that shows us all the possible combinations of inflation and real growth that are consistent with a spending growth rate of 5%.
We can also interpret this AD curve in one other way. We can think about M plus V as the growth rate of spending in the economy. Or, equivalently, it's the growth rate of nominal GDP. So, the AD curve gives us all the combinations of inflation and real growth that are consistent with a specified growth rate of nominal GDP. The AD curve for a nominal GDP growth rate of 5% -- that's all the combinations of inflation and real growth that add up to 5%.
So, what's the AD curve for a nominal GDP growth rate of 7%? Right! It's all the combinations of inflation and real growth that add up to 7%. Put that on our graph. So now we can see that an increase in the growth rate of nominal GDP -- in this case an increase in the growth rate of nominal GDP from 5% to 7% -- that shifts the AD curve outwards. Similarly, a decrease in the growth rate of nominal GDP -- that shifts the AD curve inwards. Now an increase in the growth rate of nominal GDP -- that can come from either changes in M, or changes in V.
We're going to discuss how monetary and fiscal policy, respectively, can change M and V, in later videos. For now, let's just focus on the key idea: increased spending growth shifts the AD curve outwards, and decreased spending growth shifts the AD curve inwards. In the next video, we're going to combine what we know now about the AD curve with the long-run aggregate supply curve. That will give us our first model, a model of real business cycles.
Subtitles
Thanks to our awesome community of subtitle contributors, individual videos in this course might have additional languages. More info below on how to see which languages are available (and how to contribute more!).
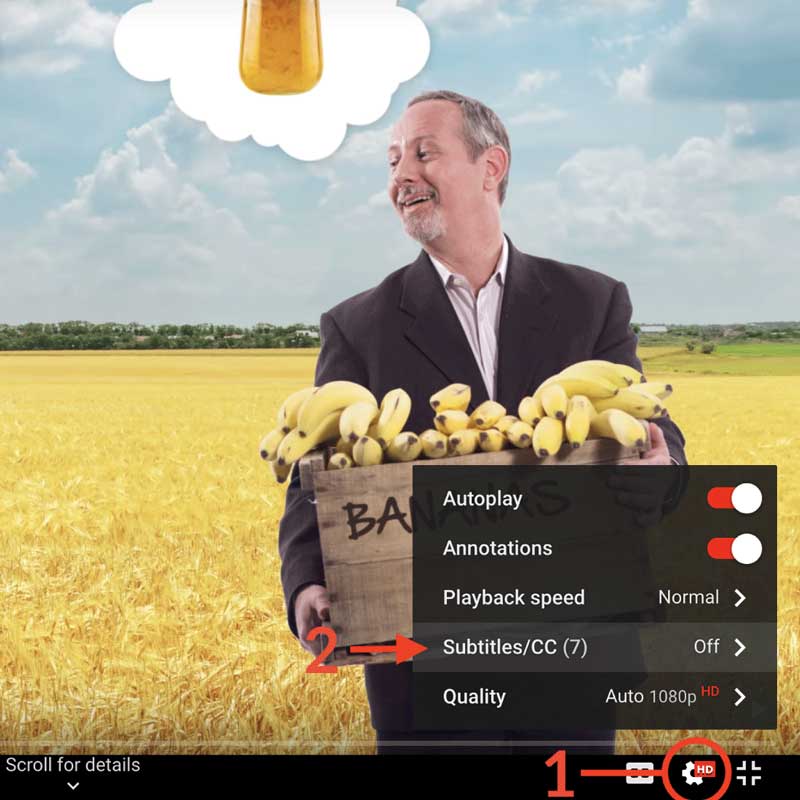
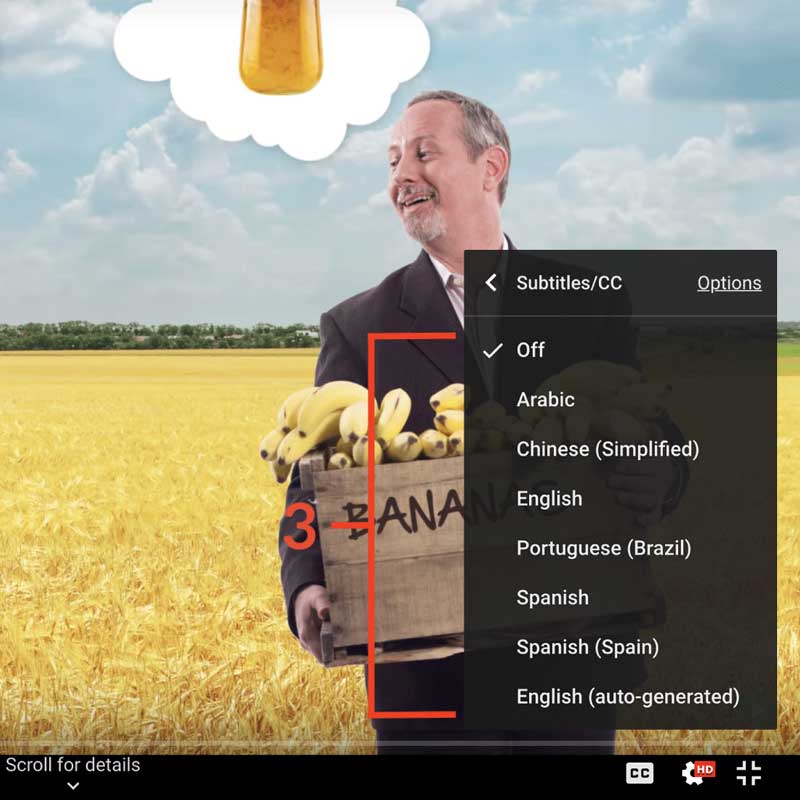
How to turn on captions and select a language:
- Click the settings icon (⚙) at the bottom of the video screen.
- Click Subtitles/CC.
- Select a language.


Contribute Translations!
Join the team and help us provide world-class economics education to everyone, everywhere for free! You can also reach out to us at [email protected] for more info.
Submit subtitles
Accessibility
We aim to make our content accessible to users around the world with varying needs and circumstances.
Currently we provide:
- A website built to the W3C Web Accessibility standards
- Subtitles and transcripts for our most popular content
- Video files for download
Are we missing something? Please let us know at [email protected]
Creative Commons

This work is licensed under a Creative Commons Attribution-NoDerivatives 4.0 International License.
The third party material as seen in this video is subject to third party copyright and is used here pursuant
to the fair use doctrine as stipulated in Section 107 of the Copyright Act. We grant no rights and make no
warranties with regard to the third party material depicted in the video and your use of this video may
require additional clearances and licenses. We advise consulting with clearance counsel before relying
on the fair use doctrine.

